Abstract
Background
Neuropathic pain is caused by lesions in the somatosensory nervous system. Pain occurs spontaneously, and responses to noxious and innocuous stimuli are pathologically amplified. Despite the abundant functional magnetic resonance imaging studies in awake human subjects, there is no available report on the behavioral correlate of differential brain areas involved in spontaneous and evoked pain symptoms in a conscious animal model. We investigated whether positron emission tomography (PET) imaging could depict the spatial changes in glucose metabolic activity in the awake male rat brain during spontaneous- and evoked-pain conditions on a spared nerve injury (SNI) model of neuropathic pain.
Methods
Two major branches of the sciatic nerve, the tibial and common peroneal nerves, were transected under anesthesia. Two PET experiments were performed. In the spontaneous pain behavior group, abnormal paw-lifting behaviors were recorded during fluorodeoxyglucose (FDG) uptake. In the allodynia group, the ipsilateral side of the lesion hindpaw was stimulated with a 6-g von Frey filament once every 5 seconds for 20 minutes during FDG uptake. Each rat was scanned twice in both experiments: once before and once from 3 to 7 days after SNI surgery. Nerves were isolated but not transected in the sham-operated control group.
Results
After SNI surgery, rats displayed spontaneous jerky paw lifting and mechanical sensitization lasting at least 4 weeks. In the spontaneous pain behavior group, glucose metabolic activity in the SNI condition significantly increased in the ipsilateral posterior insular cortex (PIC) compared to pre-surgery and the sham-operated controls. The glucose metabolic activity of the PIC was linearly correlated with the frequency of spontaneous paw lifting. In the allodynia group, changes in glucose metabolic activities in the SNI condition significantly increased in the bilateral primary somatosensory cortex, contralateral secondary somatosensory cortex, contralateral primary motor cortex, ipsilateral secondary motor cortex, ipsilateral rostral insular cortex, PIC, hypothalamus, medial thalamus (including the medial dorsal nucleus and anterior periventricular thalamic nucleus), and medial cerebellum.
Conclusions
Differential brain areas in rats with peripheral neuropathic pain were activated between mechanical hypersensitivity and spontaneous pain-related behaviors. The data suggest that PET is a useful imaging technique to establish the link between behavioral correlates and topographical representation in awake rats suffering from spontaneous pain and allodynia of neuropathic pain.
Keywords
FDG-PET, insular cortex, neuropathic pain, sciatic nerve injury
Introduction
Modern brain imaging techniques in animal models are important for studying pain function. 1-3 Animal positron emission tomography (PET) has the advantage that during the period of uptake of the tracer, the animal can be conscious and behaving. 4-6 Therefore, we can detect neural functions of the animal without anesthesia and determine the brain activity during different behavioral conditions. Several previous reports used PET to map brain changes after different kinds of pain conditions, including formalin-induced pain 5 , post-surgery hypersensitivity 6 , and colonic distention 4 . But there are still no reports of a PET study on conscious brain functional changes in neuropathic pain rats.
In the nerve injury diseases, neuropathic pain has been described as the “most terrible of all tortures which a nerve wound may inflict” and arises as a consequence of nerve injury either of the peripheral or central nervous system. 7 Recent human brain imaging studies provided clues to brain changes in patients with neuropathic pain. 8 Those studies reported that supraspinal structures play a crucial role in pain modulation. Activated areas involved the primary somatosensory cortex (SI), secondary somatosensory cortex (SII), primary motor cortex (M1), premotor cortex, anterior cingulate cortex (ACC), insular cortex (IC), prefrontal cortex (PFC), thalamus, hypothalamus, amygdala, periaqueductal grey (PAG), and cerebellum under pain condition. Most of these brain areas match those in the “pain matrix” 9,10 that is associated with the sensory-discriminative and affective-emotional aspects of pain.
The current neuropathic pain treatment strategy is to provide pain relief according to diagnosed pain diseases. However, only limited improvement has been obtained for most of the patients. 11 More ideally, specific treatment should be designed for for specific pain-generating mechanism. For example, a sodium-channel blocker for spontaneous pain and a calcium-channel blocker for mechanical allodynia. 12 However, the brain areas involved in these two common neuropathic pain symptoms are not clear. In the clinical brain imaging reports, both sensory-discriminative and affective-emotional aspects of the brain areas were activated during evoked pain. 13-20 In contrast, results from brain imaging studies of spontaneous pain in patients with neuropathic pain varied. 17,21-23 These variations might be related to difficulties in patient selection with human patient studies. In addition, it is difficult to begin imaging before the occurrence of the disease; therefore, the same patient cannot be properly followed longitudinally.
Brain imaging in animal models is able to limit individual variations. Owing to the advantage that animals can be stimulated without anesthesia, PET is a better method to distinguish the difference of brain function between spontaneous and evoked pain in the brain imaging techniques. Increased glucose metabolic activity in the peripheral nerve was confirmed by 18-fluorodeoxyglucose (FDG)-PET in a rat model of spared nerve injury (SNI) 24 , indicating that rats with neuropathic pain show increased FDG uptake in the nervous system 25 .
In the present study, we report the first functional brain image study of the comparison between spontaneous and evoked pain in conscious SNI rats by using FDG-PET to map glucose metabolic changes. Each individual rat underwent a PET scan twice in both experiments: once before nerve injury and once from 3 to 7 days after nerve injury. In addition, two series of experiments were performed. In the first experiment, we examined differences in FDG uptake of spontaneously behaving SNI rats, while in the second experiment, we examined differences in FDG uptake of SNI rats that underwent light von Frey mechanical stimuli on their hindpaw of the injured leg. The hypothesis tested here was whether SNI neuropathic rats showed differential brain changes under spontaneous pain versus under evoked allodynic conditions.
Methods
Experimental Animals
All procedures were performed on male Sprague–Dawley rats (250–350 g). Rats were kept in a 12-hour dark-light cycle environment at a temperature of 22 °C with food and water available ad libitum. All animal care and experimental procedures were approved by the Institutional Animal Care and Use Committee of National Taiwan University. The procedures adopted in this study were in accordance with “Codes for Experimental Use of Animals” of the Council of Agriculture of Taiwan, which is based on the
SNI
Under anesthesia by an intraperitoneal injection of a mixture of ketamine (75 mg/kg) and xylazine (7.5 mg/kg), the skin on the lateral surface of the left thigh was incised, and a section was made directly through the biceps femoris muscle, exposing the sciatic nerve and its three terminal branches: the sural, common peroneal, and tibial nerves. The tibial and common peroneal nerves were tightly ligated with 6.0 silk and sectioned distal to the ligation, removing 2–3 mm of the nerve distal to the ligation. Great care was taken to avoid any contact or stretching of the sural nerve. The muscles and skin were closed in two layers. For sham surgery, only the sciatic nerve and its branches were exposed without ligation or lesioning. 24
Behavioral Test
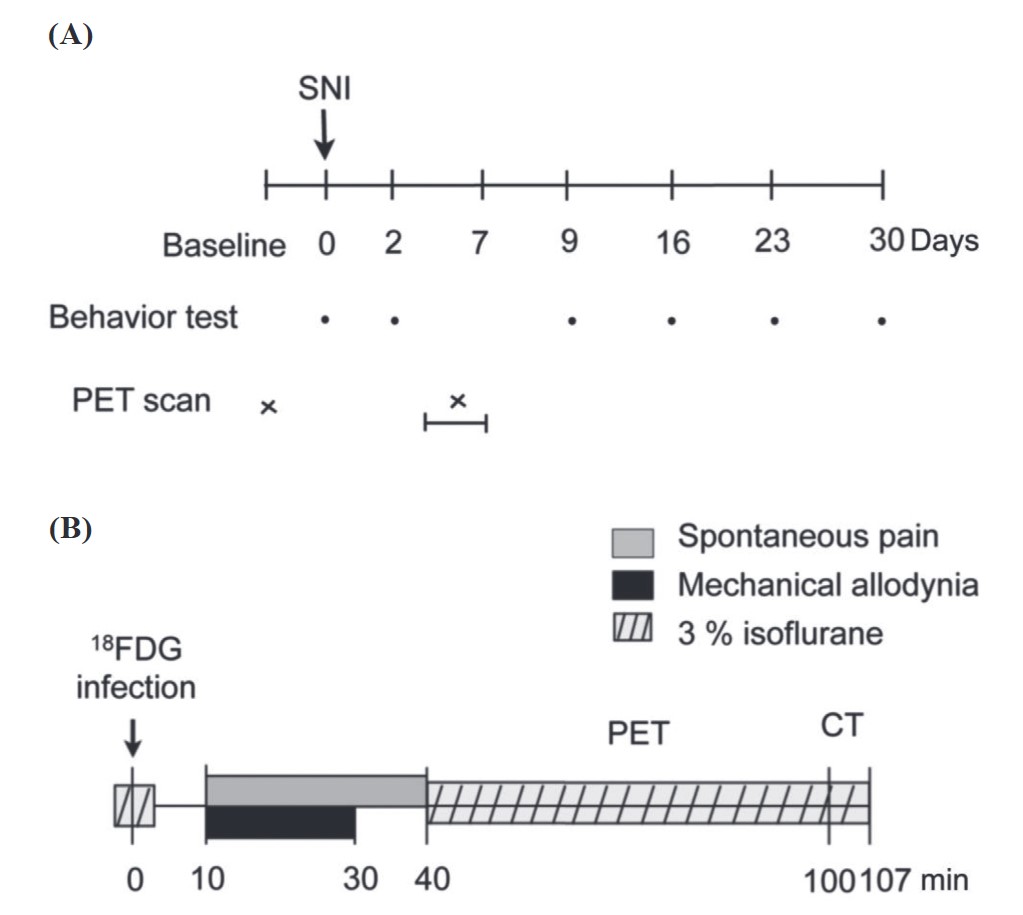
Two behavioral signs of neuropathic pain were examined: spontaneous pain and mechanical allodynia. Animals were tested before surgery, and 2, 9, 16, 23, and 30 days postoperatively (Figure 1A).
For spontaneous pain measurement, rats were placed on a glass plate at a neutral temperature (30 ± 1°C). After 5 minutes of adaptation, the cumulative number of times that the animal rapidly held its left hind paw aloft was recorded for 30 minutes 26,27 , while lifts associated with locomotion or body repositioning were not counted.
For the mechanical allodynia test, rats were placed on an elevated wire mesh, and brisk foot withdrawal in response to normally innocuous mechanical stimuli was measured using a 6-g von Frey filament, which was applied to the plantar surface of the paw with a modified staircase method. 28
Download full-size image
Small-Animal PET
Rats were separated into two groups: spontaneous pain and allodynia groups (Figure 1B). Each rat was scanned twice, once before and once from 3 to 7 days after surgery in both groups. Before the beginning of each scan, each rat received 92.5 MBq of FDG, a functional marker of metabolic activity, by an intravenous tail injection under 3% isoflurane anesthesia. After the FDG injection, rats of the spontaneous-pain group were placed in a transparent acrylic cage to record their spontaneous behaviors for 30 minutes, from 10 to 40 minutes after the injection, to quantify the rats’ spontaneous pain-related behaviors. Rats of the allodynia group were placed on an elevated wire grid, and the plantar surface of the paw was stimulated with a 6-g von Frey filament once every 5 seconds from 10 to 30 minutes after the tracer injection. In both groups, 40 minutes after the FDG injection, rats were anesthetized with 3% isoflurane, placed into a PET/computed tomographic (CT) scanner, and scanned for 60 minutes with PET, then scanned for 7 minutes with CT.
We measured FDG uptake in the brain using an eXplore Vista Dual-Ring Small-Animal PET scanner (GE Healthcare, Waukesha, WI, USA) with an average full width at half-maximum resolution of 1.26 mm. Images were first anatomically standardized to achieve a symmetrical midline alignment. Further improvements in the resolution and sensitivity of image processing were achieved using a 3D ordered subset expectation maximization (OSEM) reconstruction algorithm. The nominal voxel size was 0.3875 × 0.3875 × 0.775 mm. The former two lengths were in transverse directions, and the latter one was in the axial direction. Each of the 61 transverse slices in the reconstructed images contained 175 × 175 voxels. Standardized uptake values (SUVs) were calculated for each voxel in the reconstructed images as an index of FDG accumulation as follows:
SUV = FDGvoxel / (FDGdose / WT);
where FDGvoxel is the decay-corrected regional radiotracer concentration in becquerels per milliliter, FDGdose is the injected radiotracer dose in becquerels, and WT is the body weight in kilograms.
Statistical Parametric Mapping (SPM) of PET Images
We used a previously published voxel-based SPM analytical procedure.
29
Briefly, SPM8 software was used to co-register and spatially normalize FDG-PET images to a T2 magnetic resonance imaging (MRI) template. To extract brain regions within the FDG-PET images, we applied a mask image, which we manually generated from an individual T2 MR image using MIPAV, to the co-registered FDG-PET image. After extracting the brain regions, SUVs of the FDG-PET images were normalized by the following formula: SUV (normalized) = (SUV [original] / ∑
SUV
[original]) × 100%. Normalized FDG-PET images from all rats were co-registered to the stereotaxic space
30
with reference to the T2 template image of the rat brain
31
and resliced with trilinear interpolation (0.2 × 0.2 × 0.2 mm). Voxel-based SPM using a general linear model approach was performed using SPM8. Global changes in the SUV were removed using proportional normalization and grand mean scaling. We considered
Region of Interest (ROI) Analysis of PET Images
We chose brain areas that significantly changed in the voxel-based SPM analysis for the ROI analysis using OsiriX Imaging Software (Osirix Foundation, Geneva, Switzerland). We used the bregma in CT images and the anterior commissure in MR images as indices of coordinate bregma 0 to merge these two images. We then used the same coordinates on CT and PET to merge the PET and MRI images. Brain areas involved included the SI (hindpaw region), M1 (P0–P2), SII (A1–P3), M2, ACC (cingulate cortex A4–A2), MCC (cingulate cortex A1–P1), restorer agranular insular cortex (RAIC, A4–A2), posterior insular cortex (PIC, A1–P2), caudate putamen (A2–P3), globus pallidus (P1 and P2), paraventricular thalamic nucleus (P1), ventral posterior thalamus (P3 and P4), mediodorsal (MD) nucleus (P2 and P3), hypothalamus medial part (paraventricular hypothalamic nucleus, dorsomedial hypothalamic nucleus, and posterior hypothalamic area), hippocampus (P2–P6), and cerebellum (P10). SUVs of each area were summed up and normalized to individual whole-brain mean SUVs to calculate the ROI activation index (AI):
We compared normalized SUVs in each subregion for each of the pre- and post-surgery conditions using a paired
We also investigated the correlation between the times of spontaneous paw lifting and the AI of different brain areas in PET images by a simple linear regression.
Results
Behavioral Test
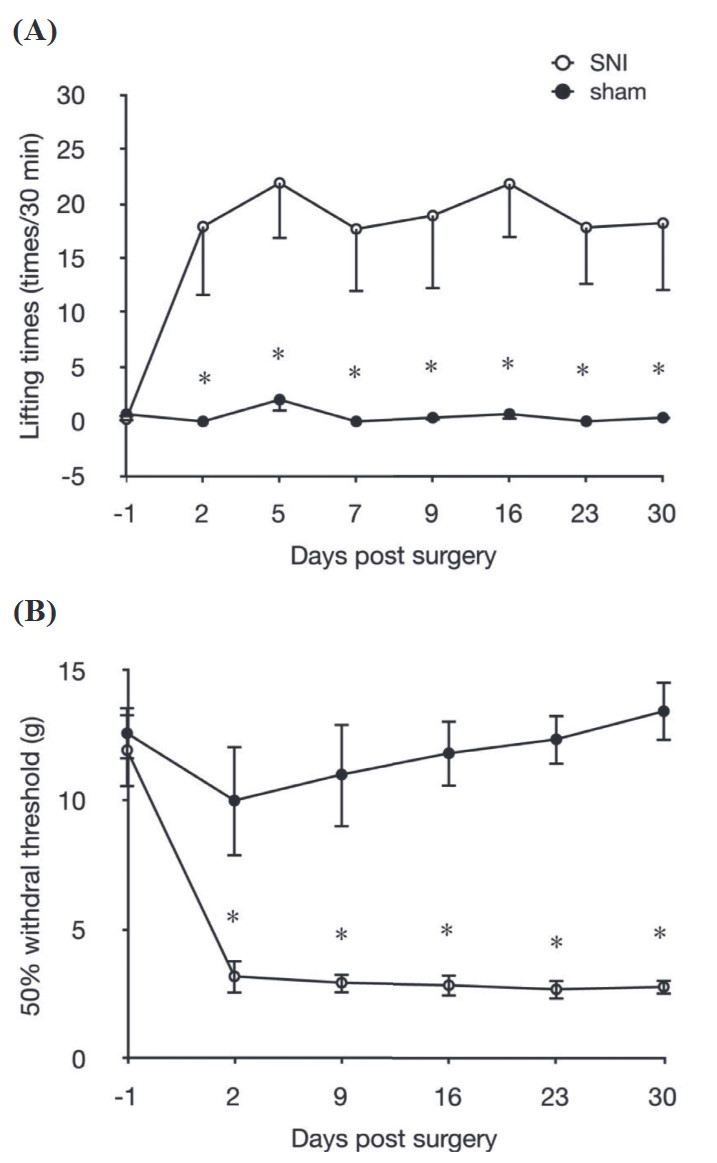
To determine differences in the time course of development of behavioral signs of neuropathic pain between the SNI and sham-operated groups, alterations in abnormal lifting behavior and the mechanical withdrawal threshold of the von Frey test were studied for 30 days after surgery. Results of the abnormal lifting behavioral recordings are shown in Figure 2A. The number of times of abnormal lifting of the ipsilateral hindpaws in the SNI group (n = 9) significantly increased at 2 days post-surgery, and remained higher for more than 30 days (
Download full-size image
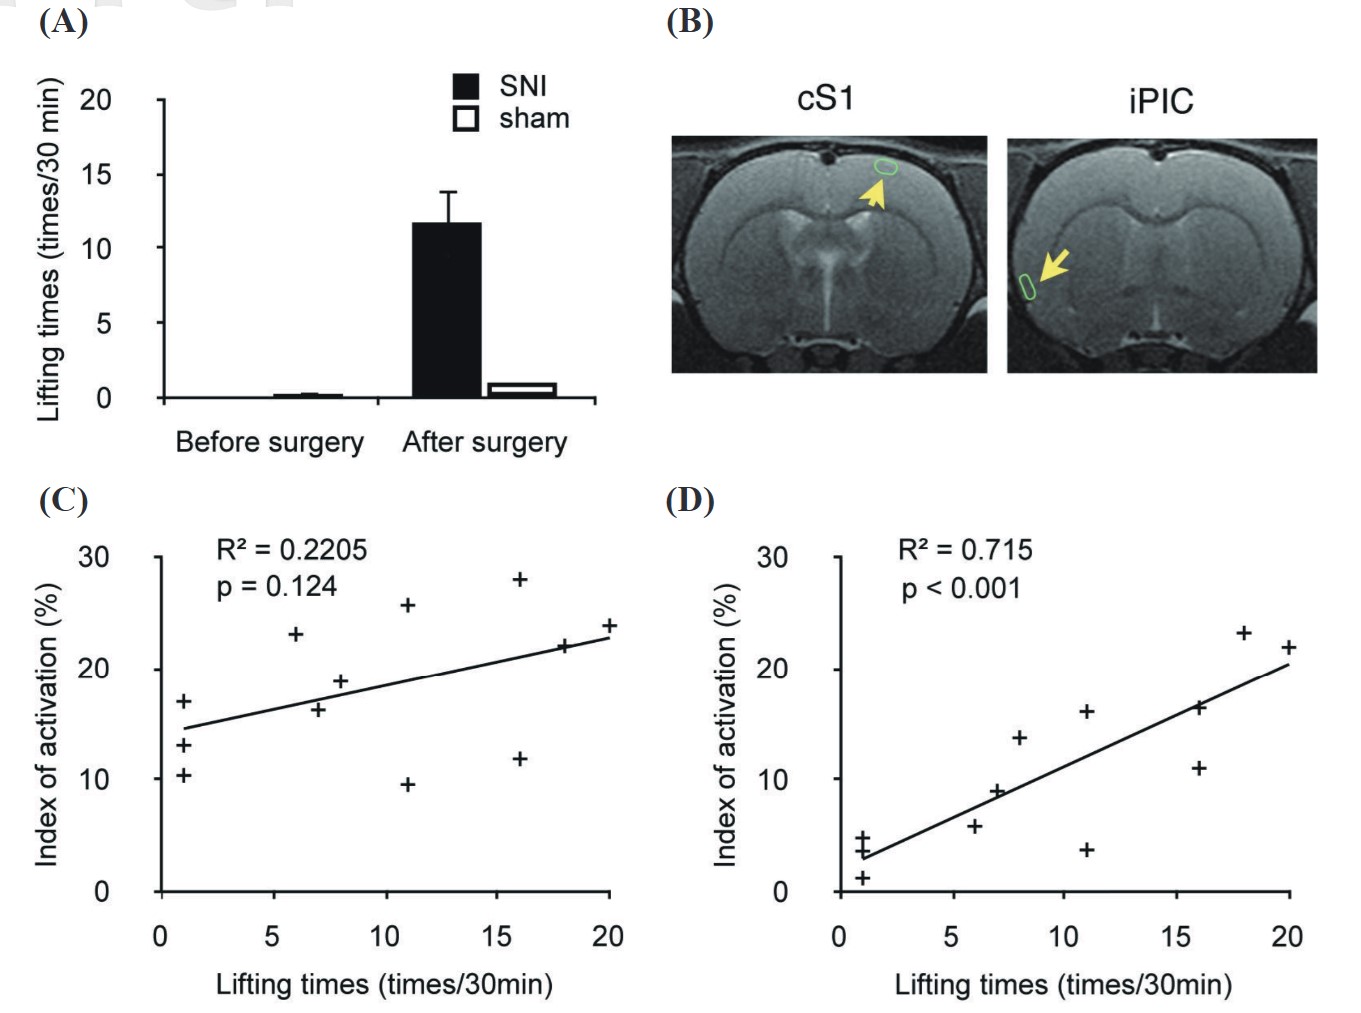
We also recorded abnormal lifting behavior of the ipsilateral paw during the FDG uptake period as an index of the intensity of spontaneous pain. The SNI group (n = 9) showed a significant increase in abnormal lifting behaviors after surgery, but the sham group (n = 3) exhibited no significant change after surgery during FDG uptake (Figure 3). This proves that rats were indeed experiencing a spontaneous-pain condition.
Download full-size image
SPM of PET Images
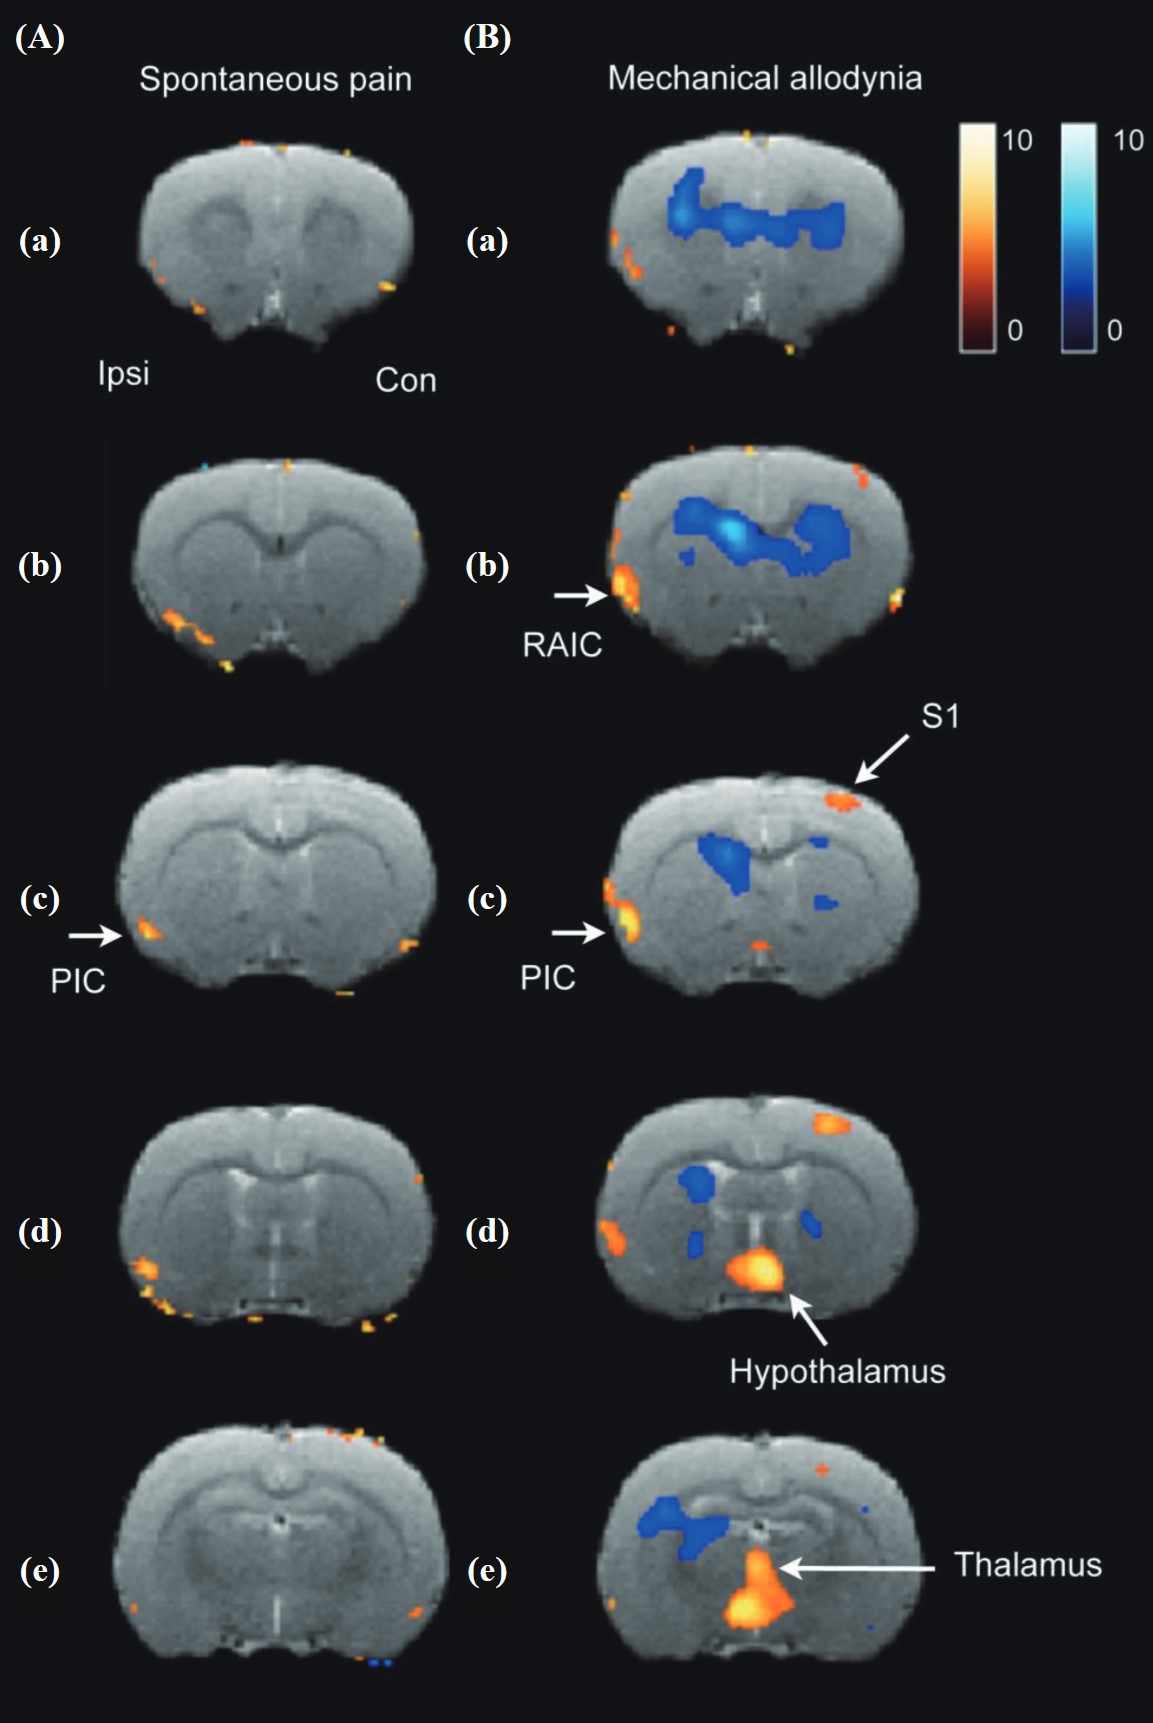
In the PET study of spontaneous paw lifting, glucose metabolic activity of the ipsilateral insular cortex in the SNI condition (n = 14) significantly increased compared to the pre-surgery control (n = 14) and sham-operated group (n = 8) according to a factorial ANOVA (Figure 4A). The arrow in Figure 4Ac indicates the position of the ipsilateral PIC. In the PET study of allodynia, a 6-g von Frey filament was used to stimulate the paw pad of the affected hindlimb. The glucose metabolic activity change in the SNI (n = 11) condition significantly increased in the contralateral S1, ipsilateral insular cortex, thalamus, and hypothalamus compared to the pre-surgery control and sham-operated group (n = 8) according to a factorial ANOVA. The above areas did not significantly change in the sham-operated group (Figure 4B).
Download full-size image
ROI Analysis of PET Images
The ROI analysis provided a more precise method to investigate SUV changes among different conditions.
32
In the PET study of spontaneous paw lifting, the index of activation change in the SNI condition significantly increased in the ipsilateral PIC compared to the pre-surgery control (
|
ROI |
Pre SNI |
Post SNI |
Pre sham |
Post sham |
|---|---|---|---|---|
|
M1 c |
23.95 ± 1.94 |
23.09 ± 1.24 |
24.47 ± 1.78 |
21.90 ± 1.52 |
|
M1 i |
21.85 ± 1.48 |
20.30 ± 1.08 |
21.82 ± 1.00 |
19.24 ± 1.80 |
|
SI c |
22.18 ± 1.39 |
22.05 ± 1.28 |
21.98 ± 1.52 |
20.55 ± 1.35 |
|
SI i |
22.01 ± 1.43 |
21.83 ± 1.25 |
20.94 ± 0.85 |
18.91 ± 1.14 |
|
SII c |
22.07 ± 1.23 |
23.63 ± 1.73 |
21.69 ± 1.29 |
23.30 ± 1.28 |
|
SII i |
20.71 ± 1.46 |
24.62 ± 1.57 a |
18.95 ± 1.70 |
24.37 ± 1.11 a |
|
RAIC c |
32.80 ± 1.87 |
34.06 ± 2.31 |
32.26 ± 1.72 |
31.63 ± 1.35 |
|
RAIC i |
32.73 ± 1.46 |
35.65 ± 2.26 |
31.59 ± 1.84 |
30.87 ± 1.45 |
|
PIC c |
12.91 ± 1.25 |
15.15 ± 1.54 |
12.25 ± 1.43 |
11.46 ± 1.18 |
|
PIC i |
11.16 ± 1.44 |
15.34 ± 1.75 a |
12.03 ± 1.26 |
12.61 ± 1.02 |
|
CPu DL c |
42.40 ± 1.99 |
41.78 ± 2.38 |
43.92 ± 2.64 |
40.49 ± 2.33 |
|
CPu DL i |
43.38 ± 1.90 |
42.54 ± 2.65 |
45.18 ± 2.93 |
40.13 ± 2.83 |
|
CPu DM c |
29.43 ± 1.78 |
28.61 ± 2.01 |
30.43 ± 2.15 |
26.45 ± 1.59 |
|
CPu DM i |
31.74 ± 1.91 |
30.21 ± 2.26 |
33.08 ± 2.06 |
28.49 ± 2.39 |
|
CPu VL c |
35.77 ± 1.81 |
35.40 ± 2.34 |
36.11 ± 1.98 |
34.02 ± 2.04 |
|
CPu VL i |
39.63 ± 1.69 |
39.67 ± 2.57 |
37.90 ± 2.71 |
37.82 ± 1.90 |
|
CPu VM c |
24.60 ± 1.57 |
24.77 ± 1.95 |
25.93 ± 1.87 |
22.50 ± 1.40 |
|
CPu VM i |
29.97 ± 1.73 |
28.82 ± 2.30 |
30.72 ± 2.23 |
27.47 ± 1.47 |
|
GP c |
7.59 ± 1.33 |
6.97 ± 1.56 |
8.12 ± 1.73 |
6.26 ± 1.45 |
|
GP i |
6.94 ± 1.86 |
7.61 ± 1.50 |
8.13 ± 25.18 |
6.62 ± 1.38 |
|
VP c |
16.07 ± 2.27 |
14.75 ± 1.99 |
17.80 ± 2.12 |
15.62 ± 1.92 |
|
VP i |
16.82 ± 2.02 |
17.02 ± 2.11 |
14.67 ± 1.14 |
16.67 ± 1.97 |
|
Cb sim c |
–19.16 ± 2.24 |
–14.86 ± 1.94 a |
–18.83 ± 1.60 |
–19.31 ± 1.83 |
|
Cb sim i |
–16.57 ± 1.76 |
–12.54 ± 2.11 a |
–17.54 ± 1.36 |
–16.31 ± 1.30 |
Abbreviations: AI, Asymmetry Index; c, contralateral; i, ipsilateral; Cb sim, cerebellum simple lobule; CPu, caudate putamen; DL, doslateral; DM, dorsal medial; GP, globus pallidus; M1: primary motor cortex; PIC, posterior insular cortex; RAIC, rostral agranular insular cortex; ROI, region of interest; SI: primary somatosensory cortex; SII, secondary somatosensory cortex, SNI, spared nerve injury; VL, ventral lateral; VM, ventral medial; VP, ventral posterior.
|
ROI |
Pre SNI |
Post SNI |
Pre sham |
Post sham |
|---|---|---|---|---|
|
ACC c |
41.21 ± 1.76 |
41.01 ± 2.65 |
43.00 ± 1.47 |
42.36 ± 2.18 |
|
ACC i |
41.14 ± 1.61 |
41.12 ± 2.23 |
43.66 ± 1.63 |
42.83 ± 2.09 |
|
MCC c |
31.24 ± 1.28 |
29.10 ± 1.42 |
32.94 ± 1.54 |
32.66 ± 3.27 |
|
MCC i |
31.29 ± 1.18 |
30.65 ± 1.86 |
32.80 ± 1.60 |
32.25 ± 2.91 |
|
MIIc |
25.98 ± 1.37 |
28.55 ± 1.66 a |
26.78 ± 1.67 |
25.99 ± 2.24 |
|
MII i |
25.60 ± 1.52 |
27.36 ± 1.53 |
26.62 ± 1.67 |
25.34 ± 2.62 |
|
M1 c |
19.36 ± 1.19 |
22.82 ± 1.13 a |
22.87 ± 1.46 |
21.56 ± 1.50 |
|
M1 i |
20.72 ± 1.89 |
22.35 ± 1.22 |
23.15 ± 1.39 |
21.20 ± 1.66 |
|
SI c |
19.76 ± 0.82 |
21.75 ± 1.40 a |
21.41 ± 0.91 |
21.42 ± 1.50 |
|
SI i |
20.60 ± 1.28 |
22.83 ± 1.18 a |
20.99 ± 0.99 |
21 71 ± 1.48 |
|
SII c |
19.79 ± 1.53 |
19.97 ± 1.75 |
20.15 ± 1.39 |
21.20 ± 1.66 |
|
SII i |
20.09 ± 1.68 |
22.98 ± 1.71 a |
21.41 ± 0.91 |
21.42 ± 1.50 |
|
RAIC c |
30.58 ± 1.94 |
32.24 ± 1.66 |
30.19 ± 1.07 |
32.74 ± 1.80 |
|
RAIC i |
29.32 ± 1.95 |
34.99 ± 1.12 a |
30.49 ± 1.68 |
32.28 ± 1.01 |
|
PIC c |
13.19 ± 1.63 |
15.72 ± 1.29 |
12.49 ± 1.02 |
13.03 ± 2.04 |
|
PIC i |
12.32 ± 1.48 |
16.82 ± 1.66 a |
13.02 ± 1.40 |
12.67 ± 1.69 |
|
CPu DL c |
39.71 ± 2.27 |
36.73 ± 2.14 |
42.92 ± 1.69 |
39.44 ± 2.26 |
|
CPu DL i |
38.37 ± 2.00 |
35.53 ± 2.27 a |
42.55 ± 1.81 |
40.90 ± 2.57 |
|
CPu DM c |
30.42 ± 13.37 |
27.14 ± 1.47 a |
33.05 ± 1.56 |
28.89 ± 1.84 |
|
CPu DM i |
32.42 ± 1.34 |
28.42 ± 1.47 a |
34.07 ± 2.06 |
30.72 ± 2.91 |
|
CPu VL c |
34.05 ± 1.66 |
30.87 ± 1.58 |
34.67 ± 1.18 |
33.22 ± 2.53 |
|
CPu VL i |
38.28 ± 1.98 |
35.67 ± 2.24 |
37.85 ± 1.61 |
37.23 ± 2.26 |
|
CPu VM c |
28.98 ± 1.38 |
27.62 ± 1.85 |
27.63 ± 1.53 |
23.92 ± 2.83 |
|
CPu VM i |
30.03 ± 0.71 |
28.43 ± 0.96 |
31.21 ± 2.31 |
28.19 ± 2.88 |
|
GP c |
7.35 ± 1.24 |
4.58 ± 0.98 |
5.89 ± 1.39 |
4.08 ± 1.06 |
|
GP i |
8.16 ± 1.33 |
5.61 ± 0.94 |
6.55 ± 1.67 |
4.94 ± 1.67 |
|
VP c |
14.51 ± 2.20 |
13.71 ± 1.26 |
12.39 ± 1.72 |
13.23 ± 1.76 |
|
VP i |
16.13 ± 1.87 |
16.51 ± 1.94 |
13.65 ± 2.00 |
13.97 ± 2.42 |
|
MD |
24.97 ± 1.09 |
26.62 ± 0.91 a |
26.34 ± 3.36 |
26.20 ± 3.20 |
|
Hypothalamus |
–11.59 ± 0.96 |
–8.99 ± 1.07 a |
–12.72 ± 0.93 |
–11.73 ± 2.01 |
|
Hipp A c |
9.92 ± 0.89 |
9.49 ± 0.99 |
11.33 ± 1.34 |
10.60 ± 0.58 |
|
Hipp A i |
10.01 ± 0.96 |
10.96 ± 0.90 |
11.98 ± 1.22 |
12.29 ± 0.51 |
|
Hipp DP c |
10.73 ± 0.61 |
9.04 ± 1.01 a |
11.92 ± 0.65 |
10.36 ± 0.52 |
|
Hipp DP i |
12.51 ± 0.63 |
10.97 ± 0.82 a |
13.42 ± 0.71 |
12.75 ± 0.73 |
|
Hipp VP c |
2.23 ± 1.15 |
–0.01 ± 1.10 a |
1.75 ± 1.64 |
2.55 ± 1.98 |
|
Hipp VP i |
4.47 ± 0.94 |
2.32 ± 0.89 a |
4.04 ± 0.83 |
5.18 ± 1.00 |
|
Cb III/IV Cb |
20.04 ± 2.13 |
23.60 ± 1.66 a |
17.11 ± 2.68 |
20.00 ± 2.06 |
Abbreviations: ACC, anterior cingulate cortex; AI, Asymmetry Index; c, contralateral; Cb III/IV Cb: cerebellum 3rd and 4th cerebellar lobules; CPu, caudate putamen; DL, doslateral; DM, dorsal medial; DP, dorsal posterior; GP, globus pallidus; Hipp, hippocampus; i, ipsilateral; MCC, medial cingulate cortex; MD, ; MII, secondary motor cortex; M1, primary motor cortex; PIC, posterior insular cortex; RAIC, rostral agranular insular cortex; ROI, region of interest; SI, ; SII, ; SNI, spared nerve injury; VL, ventral lateral; VM, ventral medial; VP, ventral posterior.
a Post-surgery compared to pre-surgery, tested by paired t-test, P < 0.05
Correlation Between the Degree of Spontaneous Paw Lifting and the AI
We recorded the abnormal lifting behavior of the ipsilateral paw during the FDG uptake period to confirm the intensity of spontaneous pain in the rats. Abnormal lifting behavior in the SNI group (n = 9) significantly increased after surgery, but the sham group (n = 3) exhibited no significant change after surgery during FDG uptake (Figure 3A). This proved that rats were indeed experiencing a spontaneous-pain condition. We then used a simple linear regression to determine the correlation between the degree of spontaneous paw lifting and the AI in different brain areas. In this analysis, 9 rats of the SNI group and 3 rats of the sham-operated group were used. The ROIs used for the ipsilateral PIC and contralateral SI are shown in Figure 3B. The ipsilateral PIC had a high correlation with spontaneous paw lifting times (
Discussion
An animal PET study combined with behavioral tests was used to investigate changes in regional brain activity of SNI rats under spontaneous and allodynic pain conditions. This report is the first brain functional imaging study that directly compared brain changes under two major neuropathic pain symptoms in conscious rats. The longitudinal study of the same rat minimized individual variation, and the free-moving condition decreased the stress effect. Compared to the pre-surgery control and sham-operated groups, the PIC was the only area that exhibited increased glucose metabolic activity in the spontaneous pain condition in the forebrain. In contrast, many forebrain areas, including the contralateral SI, SII, medial thalamus, hypothalamus, and insular cortex, exhibited increased activity under a mechanical allodynic condition, while activities in the CPu and hippocampus decreased. There seem to be two forebrain circuits subserving spontaneous pain and evoked pain in the rat.
Our results corroborate and extend previous human patient studies. In the human patients’ PET studies, resting spontaneous pain due to mononeuropathy, post-traumatic neuropathic pain, and trigeminal neuralgia 17 showed increased regional cerebral blood flow in the IC, ACC, parietal association cortex (PA), and PFC, but there was no activation in the S1 or SII. There was also reported an increase in the default mode network in the frontal cortex, PA, IC, and thalamus, but a decrease in the S1 under spontaneous pain in diabetic neuropathic pain using resting-state MRI. 22 These data from human patients showed that the brain areas of affective-emotional function increased activation under spontaneous pain, but not the sensory-discriminative function-related areas.
In contrast, in the previous literature, both aspects of pain-matrix were activated under evoked allodynia. These reports contain somatic neuropathic pain 14,19 , complex regional pain syndrome, 16,20 and trigeminal neuralgia patients 13,17,18 . During mechanical allodynia stimulus, the most commonly activated areas were S1, SII, IC, and ACC, less commonly, M1, PFC, thalamus, and cerebellum in patients. Whether using rCBF PET 14,19 or fMRI 13,16-18,20 , a similar response pattern was found in evoked pain studies. Borsook reported in a human study in which evoked versus spontaneous tics in the same patient with trigeminal neuralgia were compared by fMRI. 17 The results showed that S1, S2, M1, supplementary motor area (SMA), ACC, IC, PFC, and cerebellum were activated during evoked pain, but only M1, ACC, IC, PA, PFC, thalamus, and cerebellum during spontaneous pain. It also indicated that the activation of sensory-discriminative function was scarce in spontaneous pain. The results of the present study are in general agreement with data from human patients, but differ in the details.
Comparing our results of brain areas activated differentially by spontaneous pain and evoked condition, the S1 codes both the intensity and location-discriminative components of acute pain. Higher responses in the contralateral S1 of the hind-paw region in the allodynia group than spontaneous pain group indicated that our allodynic stimuli were successfully implemented. The significantly increased activities in M1 and M2 also reflect the greater number of lifting behaviors caused by the 6-g von Frey filament stimulus than spontaneous paw lifting. In a previous PET study of formalin-induced inflammation pain in animals 5 , the MI was activated, which correlated well with the flinching behavior of the rat, indicating that prolonged activation of the motor system in behaving animals could be detected with FDG-PET.
The medial thalamus is also an important member of the pain matrix. We detected significantly increased activities in the medial thalamus of rats at the coronal level 2 mm posterior to the bregma, which seems to correspond to either the mediodorsal nucleus of the thalamus (MD) or the anterior periventricular nucleus of the thalamus (PVA). The MD is the major relay station of the medial thalamic pain pathway that accepts signals from the spinal cord, then projects them to the limbic cortices, e.g., the ACC and insular cortex, for affective-emotional processing. 33 The PVA was implicated in chronic pain conditions. For example, the PVA was found to specifically be activated in acid injection-induced muscle pain in rodents. 34 Although human neuropathic pain brain imaging studies have reached no consensus about the medial thalamus 15,19 , in these studies, the thalamus activity was not divided into medial or lateral portions. Mechanical allodynia can activate the insular cortex, which receives projections from the medial thalamic pathway. This shows that emotion-related brain areas are highly activated in a mechanical allodynic condition.
Insular cortex activity differentially changed in spontaneous-pain and mechanical-allodynic conditions. Specifically, the ipsilateral PIC was activated in both conditions, and the RAIC only in the allodynia condition. Similar results, as revealed by manganese-enhanced MRI, showed that the ipsilateral anterior insular cortex exhibited increased activity on days 1 and 8 after SNI. 35 In patients with peripheral nerve injury of the PET study, brush-evoked allodynia is also associated with the activation of the ipsilateral insular cortex. 36 The insular cortex is an important member of the pain matrix. The patients with lesions in the insular cortex region exhibit higher heat pain thresholds than control subjects. 37 The insular cortex is also one of the most frequently activated areas in animal pain imaging studies 9,14 . Animal studies showed lesion-specific changes in the RAIC in response to persistent neuropathic pain. 38 In allodynic manifestations in CCI rats, a lesion in the PIC reversed well-established allodynia. 39
In the subcortical region, the hypothalamus was activated. The hypothalamus has well-documented nociceptive afferents and efferent fibers projecting to the brainstem and spinal cord. There are reports of inhibitory influences of the hypothalamus on dorsal horn neurons and its involvement in neuroendocrine regulatory mechanisms. 40 Human imaging studies rarely reported changes in the hypothalamus in neuropathic patients, in contrast to much animal pain research that showed hypothalamus activation. 6,29,41 This may be due to animals switching on their descending modulation pathway, because they cannot predict the timing of the noxious stimulus. Another possibility is poor spatial resolution in human brain imaging modalities, considering the size of the human hypothalamus. The resolution of human PET/fMRI is usually 2 mm cube voxel. In this situation, the hypothalamus region accounts for only 8 × 8 × 8 cubes (~ 4 cm 3 ).
In addition to mechanical stimulus-evoked paw lifting, we also quantified the abnormal spontaneous paw lifting in SNI rats. This behavior developed in a time course similar to that with mechanical allodynia, first appearing at 2 days post-surgery, and being sustained for at least 30 days. 27 In our previous study, spontaneous abnormal lifting of the paw was highly specific to the injured leg, sensitive to PAG deep-brain stimulation analgesic treatment, and congruent with mechanical allodynia. 26 In the present study, we examined this spontaneous abnormal lifting while the rat was resting in its home cage and taking up FDG during the PET procedure. This score was used to calculate the correlation with the glucose metabolic activity of the ROI in the brain. Glucose metabolic intensity in the PIC was highly correlated with the spontaneous paw lifting frequency. This information adds another piece of evidence to support the importance of the PIC in neuropathic pain.
There was an absence of increased activity in the SI in the spontaneous-pain group, which plays a role in the sensory-discriminative aspect of pain. There was also an absence of responses by the M1, which is related to abnormal lifting behavior. Our data showed that abnormal paw lifting occurred about 12 times in 30 minutes; this number of occurrences may have been insufficient to have caused a significant change in the glucose metabolic rate in the thalamocortical pathway and motor system in the PET study. But the persistent unpleasant negative emotion was sufficient to activate the glucose metabolism in the PIC. 42,43
Conclusion
We prove that PET scan is a powerful imaging technique to investigate awake animals with various presentations of neuropathic pain models. As glucose uptake is measured during the behavioral measurement on freely moving rats, the critical limitation of anesthesia or restriction-induced stress is maximally avoided. Our results indicated that the PIC and cerebellum exhibited increased activity in the spontaneous-pain group; the S1, S2, M1, M2, anterior and posterior insular cortices, thalamus, hypothalamus, and cerebellum exhibited increased activity in the allodynia group. Furthermore, the metabolic activity of the PIC was correlated with the intensity of spontaneous behaviors, suggesting that the insular cortex may play an important role in a spontaneous-pain condition. These results suggest that allodynia and spontaneous pain may recruit different forebrain circuits. In the future, we can use this behavior and brain activity patterns of the SNI neuropathic pain model to test treatment effects.
References
| 1 |
Thompson SJ, Bushnell MC.
Rodent functional and anatomical imaging of pain.
Neurosci Lett. 2012;520(2):131-139.
|
| 2 |
Seminowicz DA, Laferriere AL, Millecamps M, Yu JSC, Coderre TJ, Bushnell MC.
MRI structural brain changes associated with sensory and emotional function in a rat model of long-term neuropathic pain.
Neuroimage. 2009;47(3):1007-1014.
|
| 3 |
Jones KL, Finn DP, Governo RJM, et al.
Identification of discrete sites of action of chronic treatment with desipramine in a model of neuropathic pain.
Neuropharmacology. 2009;56(2):405-413.
|
| 4 |
Ohashi K, Ichikawa K, Chen L, Callahan M, Zasadny K, Kurebayashi Y.
MicroPET detection of regional brain activation induced by colonic distention in a rat model of visceral hypersensitivity.
J Vet Med Sci. 2008;70(1):43-49.
|
| 5 |
Shih YYI, Chiang YC, Chen JC, et al.
Brain nociceptive imaging in rats using (18)f-fluorodeoxyglucose small-animal positron emission tomography.
Neuroscience. 2008;155(4):1221-1226.
|
| 6 |
Romero A, Rojas S, Cabañero D, et al.
A 18F-fluorodeoxyglucose MicroPET imaging study to assess changes in brain glucose metabolism in a rat model of surgery-induced latent pain sensitization.
Anesthesiology. 2011;115(5):1072-1083.
|
| 7 |
Jaggi AS, Singh N.
Role of different brain areas in peripheral nerve injury-induced neuropathic pain.
Brain Res. 2011;1381:187-201.
|
| 8 |
Chen F yong, Tao W, Li Y jie.
Advances in brain imaging of neuropathic pain.
Chin Med J (Engl). 2008;121(7):653-657.
|
| 9 |
Apkarian AV, Bushnell MC, Treede RD, Zubieta JK.
Human brain mechanisms of pain perception and regulation in health and disease.
Eur J Pain. 2005;9(4):463-484.
|
| 10 |
Seifert F, Maihöfner C.
Central mechanisms of experimental and chronic neuropathic pain: findings from functional imaging studies.
Cell Mol Life Sci. 2009;66(3):375-390.
|
| 11 |
Finnerup NB, Sindrup SH, Jensen TS.
The evidence for pharmacological treatment of neuropathic pain.
Pain. 2010;150(3):573-581.
|
| 12 |
Baron R.
Mechanisms of disease: neuropathic pain—a clinical perspective.
Nat Clin Pract Neurol. 2006;2(2):95-106.
|
| 13 |
Becerra L, Morris S, Bazes S, et al.
Trigeminal neuropathic pain alters responses in CNS circuits to mechanical (brush) and thermal (cold and heat) stimuli.
J Neurosci. 2006;26(42):10646-10657.
|
| 14 |
Kupers R, Lonsdale MN, Aasvang E, Kehlet H.
A positron emission tomography study of wind-up pain in chronic postherniotomy pain.
Eur J Pain. 2011;15(7):698.
|
| 15 |
Schweinhardt P, Glynn C, Brooks J, et al.
An fMRI study of cerebral processing of brush-evoked allodynia in neuropathic pain patients.
Neuroimage. 2006;32(1):256-265.
|
| 16 |
Maihöfner C, Forster C, Birklein F, Neundörfer B, Handwerker HO.
Brain processing during mechanical hyperalgesia in complex regional pain syndrome: a functional MRI study.
Pain. 2005;114(1-2):93-103.
|
| 17 | |
| 18 |
Moisset X, Villain N, Ducreux D, et al.
Functional brain imaging of trigeminal neuralgia.
Eur J Pain. 2011;15(2):124-131.
|
| 19 |
Petrovic P, Ingvar M, Stone-Elander S, Petersson MK, Hansson P.
A PET activation study of dynamic mechanical allodynia in patients with mononeuropathy.
Pain. 1999;83(3):459-470.
|
| 20 |
Maihöfner C, Handwerker HO, Birklein F.
Functional imaging of allodynia in complex regional pain syndrome.
Neurology. 2006;66(5):711-717.
|
| 21 |
Hsieh JC, Belfrage M, Stone-Elander S, Hansson P, Ingvar M.
Central representation of chronic ongoing neuropathic pain studied by positron emission tomography.
Pain. 1995;63(2):225-236.
|
| 22 |
Cauda F, Sacco K, Duca S, et al.
Altered resting state in diabetic neuropathic pain.
PLoS One. 2009;4(2):e4542.
|
| 23 |
Geha PY, Baliki MN, Chialvo DR, Harden RN, Paice JA, Apkarian AV.
Brain activity for spontaneous pain of postherpetic neuralgia and its modulation by lidocaine patch therapy.
Pain. 2007;128(1-2):88-100.
|
| 24 |
Decosterd I, Woolf CJ.
Spared nerve injury: an animal model of persistent peripheral neuropathic pain.
Pain. 2000;87(2):149-158.
|
| 25 |
Behera D, Jacobs KE, Behera S, Rosenberg J, Biswal S.
(18)F-FDG PET/MRI can be used to identify injured peripheral nerves in a model of neuropathic pain.
J Nucl Med. 2011;52(8):1308-1312.
|
| 26 |
Lee KS, Huang YH, Yen CT.
Periaqueductal gray stimulation suppresses spontaneous pain behavior in rats.
Neurosci Lett. 2012;514(1):42-45.
|
| 27 |
Yoon C, Wook YY, Sik NH, Ho KS, Mo CJ.
Behavioral signs of ongoing pain and cold allodynia in a rat model of neuropathic pain.
Pain. 1994;59(3):369-376.
|
| 28 |
Chaplan SR, Bach FW, Pogrel JW, Chung JM, Yaksh TL.
Quantitative assessment of tactile allodynia in the rat paw.
J Neurosci Methods. 1994;53(1):55-63.
|
| 29 |
Ono Y, Lin HC, Tzen KY, et al.
Active coping with stress suppresses glucose metabolism in the rat hypothalamus.
Stress. 2012;15(2):207-217.
|
| 30 |
Paxinos G, Watson CR, Emson PC.
AChE-stained horizontal sections of the rat brain in stereotaxic coordinates.
J Neurosci Methods. 1980;3(2):129-149.
|
| 31 |
Schweinhardt P, Fransson P, Olson L, Spenger C, Andersson JLR.
A template for spatial normalisation of MR images of the rat brain.
J Neurosci Methods. 2003;129(2):105-113.
|
| 32 |
Suenaga H, Chen J, Yamaguchi K, et al.
Mechanobiological bone reaction quantified by positron emission tomography.
J Dent Res. 2015;94(5):738-744.
|
| 33 |
Dostrovsky JO, Guilbaud G.
Nociceptive responses in medial thalamus of the normal and arthritic rat.
Pain. 1990;40(1):93-104.
|
| 34 | |
| 35 |
Chao THH, Chen JH, Yen CT.
Plasticity changes in forebrain activity and functional connectivity during neuropathic pain development in rats with sciatic spared nerve injury.
Mol Brain. 2018;11(1):55.
|
| 36 |
Witting N, Kupers RC, Svensson P, Jensen TS.
A PET activation study of brush-evoked allodynia in patients with nerve injury pain.
Pain. 2006;120(1-2):145-154.
|
| 37 |
Starr CJ, Sawaki L, Wittenberg GF, et al.
Roles of the insular cortex in the modulation of pain: insights from brain lesions.
J Neurosci. 2009;29(9):2684-2694.
|
| 38 |
Alvarez P, Dieb W, Hafidi A, Voisin DL, Dallel R.
Insular cortex representation of dynamic mechanical allodynia in trigeminal neuropathic rats.
Neurobiol Dis. 2009;33(1):89-95.
|
| 39 |
Benison AM, Chumachenko S, Harrison JA, et al.
Caudal granular insular cortex is sufficient and necessary for the long-term maintenance of allodynic behavior in the rat attributable to mononeuropathy.
J Neurosci. 2011;31(17):6317-6328.
|
| 40 |
Simpson DAA, Headley MP, Lumb BM.
Selective inhibition from the anterior hypothalamus of C- versus A-fibre mediated spinal nociception.
Pain. 2008;136(3):305-312.
|
| 41 |
Hess A, Sergejeva M, Budinsky L, Zeilhofer HU, Brune K.
Imaging of hyperalgesia in rats by functional MRI.
Eur J Pain. 2007;11(1):109-119.
|
| 42 |
Damasio AR, Grabowski TJ, Bechara A, et al.
Subcortical and cortical brain activity during the feeling of self-generated emotions.
Nat Neurosci. 2000;3(10):1049-1056.
|
| 43 |