Abstract
Background
This study used the National Taiwan Health Insurance database, including prescribed medications, underlying systemic diseases, and surgical types, to evaluate the relationship between those factors and mortality after general anesthesia.
Method
This retrospective, population-based study was retrieved from the National Health Insurance Research Database in Taiwan between January 1, 2005, and December 31, 2013. We proposed a logistic regression model that can significantly predict postanesthesia mortality, which was validated in another set of databases. Moreover, we subgroup the study population into four major comparison groups, which include major organ transplantation, cardiovascular (CV) surgery, major neurosurgery, and others according to the diagnostic codes of the International Classification of Diseases, ninth revision, clinical modification codes.
Results
A total of 681,779 subjects were analyzed in this study, and the most common comorbidity was hypertension. Age was an important determinant associated with postoperative mortality among different surgical types. Perioperative prescription could reduce the risks of the operation. The major surgeries (major organ transplantation, CV surgery, and neurosurgery) were associated with increasing postoperative mortality. The prediction model performed well in the validation group (area under receiver operating characteristic curve [AUROC] = 0.8753 for in-hospital mortality; AUROC = 0.8767 for 30-day mortality).
Conclusions
The prediction model that we proposed from this nationwide study could identify the predictors for postoperative mortality. The potentially protective effects of anti-lipid, hypoglycemic, and anti-hypertensive agents were encouraging in the geriatric preoperative group. It is expected that applying this prediction model and prescription into clinical practice could improve surgical risk stratification and further improve patient outcomes.
Keywords
general anesthesia, geriatric, mortality risk, population-based study, risk-prediction model
Introduction
The Charlson comorbidity index, which was introduced in 1987 and updated in 2011, consists of 12 comorbidities rather than the original 17 comorbidities and has shown a good ability to discriminate outcomes in hospital mortality after surgery. 1 The newly developed Preoperative Score to Predict Postoperative Mortality (POSPOM) using ICD 10th revision codes showed good calibration and excellent discrimination for in-hospital mortality in the development and validation cohorts. 2 Many large scale studies have done this kind of research in the past and have also tried to reproduce this predictive function, due to different degrees of restriction factors such as single surgery, 3 emergency surgery, 4 or only in large medical centers with discharge records, or operations for patients over 18 years old. 2 In fact, the mortality risk of patients older than 18 years old is not high, and it is no wonder that other studies consider the reproducibility rate to be very low. 5 The above studies strive to establish a new objective evaluation tool to include an individual’s comorbidities and surgery types to predict postanesthetic mortality.
In previous studies, elderly patients underwent an increasing number of operations and usually developed more postoperative complications with poorer outcomes. 6,7 The Multidimensional Frailty Score based on comprehensive geriatric assessments demonstrates the importance of geriatric functional independence and predicts postoperative mortality risk and postoperative complications well. 8 Another previous study using age, sex, and type of surgery of geriatric patients to match death and survival groups from the Taiwan health insurance data suggested that the leading comorbidities associated with 30-day postanesthetic mortality in geriatric patients were chronic renal disease, acute myocardial infarction, and intracranial haemorrhage. 9
This study collected the National Health Insurance (NHI) data, which provides universal, mandatory coverage of every Taiwanese from newborn until death since 1995. 10 Great efforts were made to collect existing information and identify risk factors to predict postanesthetic mortality, which is not a common event for the general population. Therefore, it is difficult to draw the association of disease and death with a limited sample size. In this study, we aimed to investigate the independent predictors of mortality following surgeries under general anesthesia (GA) by analysing the NHI database in Taiwan, which several studies have published by using reimbursement claims data from, 11,12 aiming to stratify independent risk predictors and develop a model to estimate the probability of postanesthetic mortality and to validate it with another set of databases. This study includes all the medical facilities, including medical centres, regional hospitals, and clinics. The Medical Center is one of the domestic medical institutions which fully implemented hospital evaluation by the Ministry of Health and Welfare of Taiwan. There are 23 medical centers out of 495 hospitals in 2013. 10 We proposed a logistic regression model that predicts postanesthesia mortality. We also designed different models for four subgroups according to the results.
Methods
Data Source
A single-payer and compulsory NHI program was launched by the Taiwanese government in 1995. The Taiwan NHI database includes complete hospital admissions, prescriptions, surgery or procedures, disease, and vital status for 99% of the country’s population (nearly 23 million Taiwanese). The enrolment rate has been 99% since 2010. The current analyses linked several large, computerized claims datasets with the National Death Registry through the use of birth dates and civil identification numbers unique to each beneficiary. The protocol of this study was approved by the National Taiwan University Hospital Research Ethics Committee (Trial Registration 201411078RINC) and Department of Statistics, Ministry of Health and Welfare (MOHW) (Trial approved number H105109). The requirement for informed consent was waived due to the retrospective and anonymous nature of the claims data. All analyses were performed in accordance with relevant guidelines and regulations.
Study Population
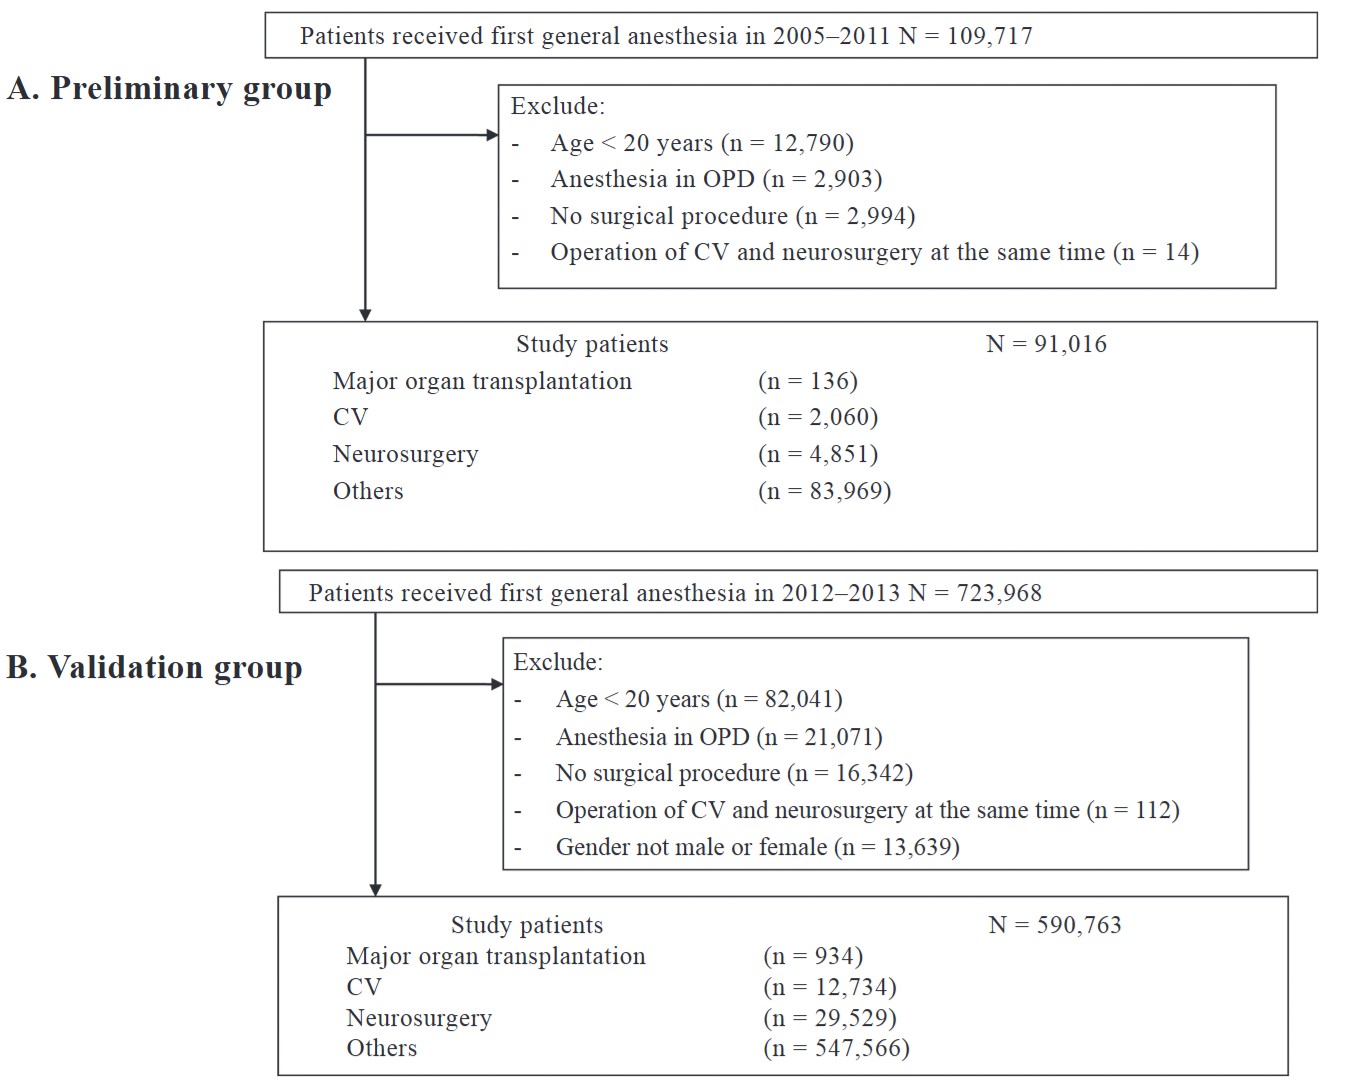
We identified patients receiving the first GA from the claims database for the preliminary group (the training set) from the one million sampling out of the 21 million population from January 1, 2005 to December 31, 2011 and validation analysis from the whole population database between January 1, 2012 and December 31, 2013. Subjects were excluded in case of (1) age less than 20 years, (2) anesthesia in the outpatient department, (3) no surgical procedure, (4) operation of cardiovascular (CV) and neurosurgical at the same time, and (5) uncertain sex.
Demographic data were recorded regarding age, sex, surgery time, hospital level, comorbidities, pharmacy prescriptions, outpatient visits, emergency room visits, and hospitalization details. The American Society of Anesthesiologists classification was not included in the NHI database. In-hospital mortality and 30-day mortality were retrieved from the index date (date of anesthesia) to the death date, which was recorded in the NHI death dataset coding for vital status and cause of death. A total of 91,016 patients were identified as the preliminary group (the training set) by using the algorithm from the one million sampling out of the 21 million population from 2005 to 2011, and 590,763 patients from the whole population database from 2012 to 2013 were used as the validation group (Figure 1).
Download full-size image
Preliminary (A) and validation (B) group study algorithm.
Abbreviations: CV, cardiovascular; OPD, outpatient department.
Covariate Ascertainment and Adjustment
The inpatient and outpatient diagnosis files and prescription data during the 12-month period before the index date were used to ascertain the patients’ past history. We classified the study patients into four major comparison groups by surgical procedures, including (1) major organ transplantation (heart, liver, lung, kidney, or pancreas), (2) CV surgery, (3) major neurosurgery, and (4) others according to the diagnostic codes of the international classification of diseases, ninth revision, clinical modification (ICD-9-CM) codes (Table S1 in Supplement). The surgical time with anesthesia and the underlying comorbidity were also defined (Tables S2 and S3 in Supplement). In order to minimize selection bias, a comorbidity was confirmed if a diagnosis was registered by physicians on at least three healthcare visits. Because the disease categorization was complex, we aggregated codes into disease groups to resemble clinical usage, and this process was conducted by three clinicians. The prescription data were used to ascertain patients’ medical history (Table S4 in Supplement).
Outcome Ascertainment and Follow-up
The primary outcome was in-hospital mortality, and the secondary outcome was death within 30 days following the index date.
Statistical Analyses
Baseline characteristics, comorbidities, medication use, and resource utilization with medical cost were summarized and analyzed. The participants were further stratified according to sex (men and women) and age. The age-specific estimates were calculated for groups aged < 65 years, 65–74 years, and ≥ 75 years. Categorical variables were compared with the χ
2
test (or Fisher’s exact test), and continuous variables were compared with Student’s
The following predictors were included in the model: sex, age, surgical time, and hospital level (medical centre or not). Factors associated with mortality were calculated, and odds ratios (ORs), 95% confidence intervals (CIs), and
All statistical analyses were performed with SAS 9.2 (SAS Institute, Cary, NC, USA). Two-tailed
Results
After excluding subjects who did not meet the study criteria, a total of 91,016 patients who received GA were included in the preliminary group for initial model training, and 590,763 patients were selected as the validation group for further analysis (Figure 1). The baseline characteristics of the preliminary group are presented in Table 1. The mean age of the total included patients is 52 years, and the percentage of patients under 65 years is 74%. For the hospital level, 49% of the patients were seen in the medical center, and 51% of the patients were seen in others. Regarding comorbidities, 24.7% of the patients had hypertension, 11.5% had chronic pulmonary disease, and 12.9% had diabetes.
|
Characteristic |
All (n = 91,016) |
Major organ transplantation (n = 136) |
CV (n = 2,060) |
Neurosurgery (n = 4,851) |
Other (n = 83,969) |
|---|---|---|---|---|---|
|
(%) |
(%) |
(%) |
(%) |
(%) |
|
|
Mean age, years (SD) |
52.0 (17.2) |
49.6 (9.6) |
62.8 (14.6) |
56.9 (17.7) |
51.5 (17.1) |
|
Age, n (%) |
|||||
|
< 65 |
67,187 (73.8) |
134 (98.5) |
1,032 (50.1) |
3,033 (62.5) |
62,988 (75.0) |
|
65–74 |
12,977 (14.3) |
2 (1.5) |
534 (25.9) |
884 (18.2) |
11,557 (13.8) |
|
> 75 |
10,852 (11.9) |
0 |
494 (24.0) |
934 (19.3) |
9,424 (11.2) |
|
Gender, n (%) |
|||||
|
Female |
49,359 (54.2) |
44 (32.4) |
697 (33.8) |
1,829 (37.7) |
46,789 (55.7) |
|
Male |
41,657 (45.8) |
92 (67.6) |
1,363 (66.2) |
3,022 (62.3) |
37,180 (44.3) |
|
Surgery time, n (%) |
|||||
|
< 2 hours |
44,155 (48.5) |
0 |
142 (6.9) |
1,535 (31.6) |
42,478 (50.6) |
|
2.0–2.5 hours |
12,014 (13.2) |
0 |
49 (2.4) |
601 (12.4) |
11,364 (13.5) |
|
2.5–3.0 hours |
9,301 (10.2) |
3 (2.2) |
53 (2.6) |
512 (10.6) |
8,733 (10.4) |
|
3.0–3.5 hours |
6,268 (6.9) |
10 (7.4) |
65 (3.2) |
382 (7.9) |
5,811 (6.9) |
|
3.5–4.0 hours |
4,869 (5.3) |
10 (7.4) |
99 (4.8) |
354 (7.3) |
4,406 (5.2) |
|
> 4 hours |
14,409 (15.8) |
113 (83.1) |
1,652 (80.2) |
1,467 (30.2) |
11,177 (13.3) |
|
Hospital level, n (%) |
|||||
|
Center |
44,702 (49.1) |
124 (91.2) |
1,413 (68.6) |
2,577 (53.1) |
40,588 (48.3) |
|
Others |
46,314 (50.9) |
12 (8.8) |
647 (31.4) |
2,274 (46.9) |
43,381 (51.7) |
|
Comorbidity, n (%) |
|||||
|
Congestive heart failure |
3,769 (4.1) |
33 (24.3) |
637 (30.9) |
242 (5.0) |
2,857 (3.4) |
|
Cardiac arrhythmias |
4,650 (5.1) |
13 (9.6) |
440 (21.4) |
300 (6.2) |
3,897 (4.6) |
|
Valvular disease |
2,552 (2.8) |
10 (7.4) |
489 (23.7) |
124 (2.6) |
1,929 (2.3) |
|
Pulmonary circulation disorders |
217 (0.2) |
6 (4.4) |
43 (2.1) |
11 (0.2) |
157 (0.2) |
|
Peripheral vascular disorders |
1,871 (2.1) |
2 (1.5) |
250 (12.1) |
125 (2.6) |
1,494 (1.8) |
|
Hypertension |
22,440 (24.7) |
49 (36.0) |
1,096 (53.2) |
1,556 (32.1) |
19,739 (23.5) |
|
Paralysis |
958 (1.1) |
0 |
31 (1.5) |
122 (2.5) |
805 (1.0) |
|
Other neurological disorders |
2,106 (2.3) |
5 (3.7) |
52 (2.5) |
372 (7.7) |
1,677 (2.0) |
|
Chronic pulmonary disease |
10,502 (11.5) |
18 (13.2) |
470 (22.8) |
591 (12.2) |
9,423 (11.2) |
|
Diabetes |
11,717 (12.9) |
30 (22.1) |
629 (30.5) |
699 (14.4) |
10,359 (12.3) |
|
Hypothyroidism |
2,123 (2.3) |
0 |
26 (1.3) |
61 (1.3) |
2,036 (2.4) |
|
Renal failure |
3,487 (3.8) |
60 (44.1) |
231 (11.2) |
201 (4.1) |
2,995 (3.6) |
|
Liver disease |
4,175 (4.6) |
47 (34.6) |
84 (4.1) |
194 (4.0) |
3,850 (4.6) |
|
Peptic ulcer disease excluding bleeding |
12,071 (13.3) |
31 (22.8) |
322 (15.6) |
509 (10.5) |
11,209 (13.3) |
|
AIDS/HIV |
41 (0.0) |
0 |
0 |
6 (0.1) |
35 (0.0) |
|
Lymphoma |
221 (0.2) |
0 |
6 (0.3) |
24 (0.5) |
191 (0.2) |
|
Metastatic cancer |
908 (1.0) |
0 |
24 (1.2) |
85 (1.8) |
799 (1.0) |
|
Solid tumor without metastasis |
10,389 (11.4) |
26 (19.1) |
151 (7.3) |
350 (7.2) |
9,862 (11.7) |
|
Rheumatoid arthritis/collagen vascular diseases |
3,895 (4.3) |
5 (3.7) |
91 (4.4) |
187 (3.9) |
3,612 (4.3) |
|
Coagulopathy |
406 (0.4) |
15 (11.0) |
21 (1.0) |
27 (0.6) |
343 (0.4) |
|
Obesity |
505 (0.6) |
0 |
7 (0.3) |
21 (0.4) |
477 (0.6) |
|
Weight loss |
699 (0.8) |
0 |
18 (0.9) |
44 (0.9) |
637 (0.8) |
|
Fluid and electrolyte disorders |
2,135 (2.3) |
9 (6.6) |
98 (4.8) |
160 (3.3) |
1,868 (2.2) |
|
Blood loss anemia |
877 (1.0) |
0 |
14 (0.7) |
16 (0.3) |
847 (1.0) |
|
Deficiency anemia |
2,074 (2.3) |
8 (5.9) |
42 (2.0) |
56 (1.2) |
1,968 (2.3) |
|
Alcohol abuse |
1,306 (1.4) |
11 (8.1) |
18 (0.9) |
136 (2.8) |
1,141 (1.4) |
|
Drug abuse |
197 (0.2) |
0 |
6 (0.3) |
14 (0.3) |
177 (0.2) |
|
Psychoses |
949 (1.0) |
0 |
16 (0.8) |
92 (1.9) |
841 (1.0) |
|
Depression |
4,021 (4.4) |
5 (3.7) |
66 (3.2) |
297 (6.1) |
3,653 (4.4) |
|
Medication use, n (%) |
|||||
|
Biguanides |
7,679 (8.4) |
16 (11.8) |
407 (19.8) |
468 (9.6) |
6,788 (8.1) |
|
Sulfonylurea |
7,968 (8.8) |
19 (14.0) |
453 (22.0) |
485 (10.0) |
7,011 (8.3) |
|
α -glucosidase inhibitors |
1,855 (2.0) |
6 (4.4) |
132 (6.4) |
108 (2.2) |
1,609 (1.9) |
|
Thiazolidinediones |
1,885 (2.1) |
8 (5.9) |
110 (5.3) |
107 (2.2) |
1,660 (2.0) |
|
Glinides |
1,414 (1.6) |
7 (5.1) |
105 (5.1) |
95 (2.0) |
1,207 (1.4) |
|
Any oral anti-diabetic agents |
10,510 (11.5) |
28 (20.6) |
564 (27.4) |
630 (13.0) |
9,288 (11.1) |
|
Fast-acting insulins |
2,938 (3.2) |
24 (17.6) |
245 (11.9) |
189 (3.9) |
2,480 (3.0) |
|
ACE inhibitors |
7,989 (8.8) |
20 (14.7) |
710 (34.5) |
567 (11.7) |
6,692 (8.0) |
|
Angiotensin receptor blockers |
8,027 (8.8) |
40 (29.4) |
647 (31.4) |
533 (11.0) |
6,807 (8.1) |
|
α -blockers |
3,243 (3.6) |
12 (8.8) |
184 (8.9) |
249 (5.1) |
2,798 (3.3) |
|
β -blockers |
18,087 (19.9) |
68 (50.0) |
1,122 (54.5) |
1,166 (24.0) |
15,731 (18.7) |
|
Calcium channel blockers |
20,624 (22.7) |
50 (36.8) |
1,124 (54.6) |
1,465 (30.2) |
17,985 (21.4) |
|
Diuretics |
13,659 (15.0) |
81 (59.6) |
1,010 (49.0) |
868 (17.9) |
11,700 (13.9) |
|
Other anti-hypertensive agents |
721 (0.8) |
14 (10.3) |
81 (3.9) |
41 (0.8) |
585 (0.7) |
|
Statins |
7,929 (8.7) |
21 (15.4) |
637 (30.9) |
421 (8.7) |
6,850 (8.2) |
|
Fibrates |
2,879 (3.2) |
2 (1.5) |
156 (7.6) |
176 (3.6) |
2,545 (3.0) |
|
Digitalis glycoside |
1,497 (1.6) |
20 (14.7) |
330 (16.0) |
92 (1.9) |
1,055 (1.3) |
|
Anti-arrhythmics class I and III |
1,902 (2.1) |
18 (13.2) |
227 (11.0) |
145 (3.0) |
1,512 (1.8) |
|
Mean number of different prescription drugs (SD) |
23.3 (17.2) |
34.0 (19.0) |
32.6 (20.8) |
22.7 (18.2) |
23.1 (17.0) |
|
Mean number of cardiovascular-related medications (SD) |
1.6 (2.7) |
4.9 (4.2) |
6.0 (4.6) |
2.0 (2.8) |
1.5 (2.5) |
|
Mean number of outpatient visit (SD) |
25.9 (22.4) |
37.4 (19.8) |
32.4 (25.7) |
24.9 (24.1) |
25.8 (22.2) |
|
Mean number of emergency room visit (SD) |
0.7 (2.1) |
2.1 (5.8) |
1.3 (2.1) |
0.9 (2.7) |
0.7 (2.0) |
|
Mean number of hospitalization (SD) |
0.3 (0.9) |
1.6 (1.7) |
0.9 (1.3) |
0.4 (1.0) |
0.3 (0.9) |
|
Mean days of hospitalization (SD) |
2.5 (11.3) |
15.4 (23.8) |
6.1 (13.0) |
3.5 (13.1) |
2.4 (11.1) |
|
Mean follow-up days (SD) |
29.8 (1.9) |
29.4 (2.8) |
29.0 (4.7) |
28.6 (5.4) |
29.9 (1.3) |
|
Mean person-year follow-up (SD) |
0.0795 (0.0051) |
0.0785 (0.0074) |
0.0773 (0.0125) |
0.0764 (0.0143) |
0.0798 (0.0035) |
|
Sum of person-year follow-up |
7,239.48 |
10.68 |
159.17 |
370.8 |
6,698.83 |
|
Resource utilization of index hospitalization |
|||||
|
Days of hospitalization |
|||||
|
Mean (SD) |
10.7 (31.6) |
41.2 (41.4) |
24.9 (37.7) |
28.2 (62.4) |
9.3 (28.2) |
|
Median (Q1–Q3) |
5 (3–10) |
29 (15–51) |
17 (11–27) |
14 (7–31) |
5 (3–9) |
|
Medical cost |
|||||
|
Mean (SD) |
108,187 (207,469.9) |
1214,102 (938,757.1) |
484,404 (384,955.0) |
271,852 (374,019.7) |
87,711 (161,571.5) |
|
Median (Q1–Q3) |
54,891 (35,950–102,692) |
978,193 (366,156–1841,393) |
428,177 (323,254–495,202) |
171,012 (80,513–335,195) |
53,636 (35,027–88,189) |
|
Mortality rate |
|||||
|
Death within 30 days, n (%) |
962 (1.1) |
6 (4.4) |
125 (6.1) |
336 (6.9) |
495 (0.6) |
|
30 days mortality rate, per 100 py |
|||||
|
(95% CI) |
12.94 (12.14–13.78) |
54.71 (24.58–121.78) |
76.48 (64.18–91.13) |
88.25 (79.3–98.21) |
7.19 (6.59–7.86) |
|
Death during admission, n (%) |
1,388 (1.5) |
11 (8.1) |
155 (7.5) |
384 (7.9) |
838 (1.0) |
Abbreviations: ACE, angiotensin-converting-enzyme; CV, cardiovascular; SD, standard deviation.
In the medication prescription category, not surprisingly, antihypertensive agents were most frequently used in high-risk surgical patients, including angiotensin-converting-enzyme inhibitors, angiotensin receptor blockers, α-blockers, β-blockers, calcium channel blockers, diuretics, and other antihypertensive agents, in both groups. In the patients who received CV surgery, 35% received ACE inhibitors, 31% received angiotensin receptor blockers, and 55% needed beta-blockers and calcium channel blockers. A total of 49% of this group needed diuretics.
The total mortality number is 962 (1.1%). Moreover, the mortality of major organ transplant is 4.4% (6/136), the mortality of patients who underwent CV procedure is 6.1% (125/2,060), the crude mortality of neurosurgery procedure is 6.9% (336/4,851), and the crude mortality of patient who underwent others is 0.6% (495/83,969). Patients with CV and major neurosurgical procedures had a higher crude incidence rate of death (6.1% and 6.9%, respectively) and mortality rate within 30 days (76.48% and 88.25%, respectively). The medical cost was also associated with the duration of hospitalization after the operation, and the patients who received major organ transplantation had the highest utilization of medical resources (Table 1). Compared with the other groups, the patients who underwent major organ transplantation, CV surgery, and neurosurgery were associated with a significantly higher 30-day mortality (Table 1).
In the crude analysis of factors associated with mortality in the preliminary group, all the statistically significant characteristics of the in-hospital mortality and 30-day mortality groups are shown in Table 2. Compared with major organ transplantation and CV surgery groups, the neurosurgery group was associated with the highest risk of postoperative mortality, with adjusted ORs ranging from 6.94 to 10.37 (Table 2). After the stratified analysis, age also showed a significant influence on postoperative mortality, especially in the elderly groups (Table 2).
For subgroup analysis, variables of the underlying comorbidities were almost positively related to postoperation mortality (Table 2). Hypertension was not associated with an increased risk of postoperative mortality (adjusted OR: 0.77, CI: 0.64–0.93) compared to the other comorbidities (Table 2). Nevertheless, prescription with statins seemed to be protective for the patient who had GA (adjusted OR: 0.8, CI: 0.67–0.96, Table 2).
|
In-hospital mortality |
30-day mortality |
|||||||
|---|---|---|---|---|---|---|---|---|
|
Covariates selected |
Adjusted OR |
95% CI |
|
Covariates selected |
Adjusted OR |
95% CI |
|
|
|
Surgical types |
< 0.0001 |
Surgical types |
< 0.0001 |
|||||
|
Others |
Reference |
Others |
Reference |
|||||
|
CV |
4.25 |
3.49–5.17 |
CV |
6.37 |
5.12–7.92 |
|||
|
Neurosurgery |
6.94 |
6.08–7.91 |
Neurosurgery |
10.37 |
8.94–12.03 |
|||
|
Organ transplant |
5.20 |
2.67–10.13 |
Organ transplant |
4.40 |
1.85–10.51 |
|||
|
Age |
< 0.0001 |
Age |
< 0.0001 |
|||||
|
< 65 years |
Reference |
< 65 years |
Reference |
|||||
|
65–74 years |
2.13 |
1.82–2.49 |
65–74 years |
1.96 |
1.63–2.36 |
|||
|
≥ 75 years |
4.49 |
3.90–5.16 |
≥ 75 years |
3.90 |
3.30–4.60 |
|||
|
Female vs. Male |
0.65 |
0.58– 0.73 |
< 0.0001 |
Female vs. Male |
0.71 |
0.62–0.82 |
< 0.0001 |
|
|
Hospital level (others vs. medical center) |
1.13 |
1.01–1.27 |
0.0307 |
Hospital level (others vs. medical center) |
1.38 |
1.20–1.57 |
< 0.0001 |
|
|
Peripheral vascular disorders |
0.71 |
0.53–0.94 |
0.0186 |
Other neurological disorders |
0.66 |
0.47–0.91 |
0.0102 |
|
|
Renal failure |
1.43 |
1.19–1.71 |
0.0001 |
Hypertension |
0.77 |
0.64– 0.93 |
0.0062 |
|
|
Liver disease |
1.25 |
1.01–1.54 |
0.0367 |
Renal failure |
1.59 |
1.27–2.00 |
< 0.0001 |
|
|
Weight loss |
1.77 |
1.23–2.55 |
0.0023 |
Liver disease |
1.44 |
1.12–1.84 |
0.0043 |
|
|
Fluid and electrolyte disorders |
1.42 |
1.15–1.75 |
0.0010 |
Coagulopathy |
1.99 |
1.20–3.28 |
0.0074 |
|
|
Blood loss anemia |
1.81 |
1.21–2.69 |
0.0036 |
Alcohol abuse |
2.43 |
1.74–3.41 |
< 0.0001 |
|
|
Alcohol abuse |
2.09 |
1.55–2.82 |
< 0.0001 |
Psychoses |
1.89 |
1.22–2.93 |
0.0044 |
|
|
Psychoses |
1.62 |
1.09–2.39 |
0.0160 |
Directics |
1.44 |
1.22–1.69 |
< 0.0001 |
|
|
Fast-acting insulins |
1.42 |
1.17–1.71 |
0.0003 |
Antiarrhythmics class I and III |
1.45 |
1.11–1.89 |
0.0060 |
|
|
Diuretics |
1.53 |
1.34–1.75 |
< 0.0001 |
Number of emergency room visit |
1.02 |
1.00–1.03 |
0.0189 |
|
|
Statins |
0.80 |
0.67–0.96 |
0.0133 |
Number of hospitalization |
1.06 |
1.01–1.12 |
0.0217 |
|
|
Antiarrhythmics class I and III |
1.51 |
1.22– 1.86 |
0.0002 |
Number of outpatient visit |
0.99 |
0.99–1.00 |
0.0005 |
|
|
Number of outpatient visit |
0.99 |
0.99–1.00 |
< 0.0001 |
|||||
|
Number of emergency room visit |
1.01 |
1.00–1.03 |
0.0480 |
|||||
|
Number of hospitalization |
1.10 |
1.05–1.15 |
< 0.0001 |
|||||
Abbreviations: CI, confidence interval; CV, cardiovascular; OR, odds ratio.
The results of factors associated with postoperation mortality for different surgery types in the preliminary group are shown in Table 3 (in-hospital mortality and 30-day mortality). As different surgical types were considered, age was still a significant determining factor associated with postoperative mortality (Table 3).
|
CV |
Neurosurgery |
Transplantation |
Other |
||||||||
|---|---|---|---|---|---|---|---|---|---|---|---|
|
In-hospital mortality |
|||||||||||
|
Covariates selected |
AOR |
95% CI |
Covariates selected |
AOR |
95% CI |
Covariates selected |
AOR |
95% CI |
Covariates selected |
AOR |
95% CI |
|
AUROC |
0.6652 |
AUROC |
0.6467 |
AUROC |
0.8418 |
AUROC |
0.8677 |
||||
|
Age < 65 y/o 65–74 y/o ≥ 75 y/o |
Reference 1.49 2.10 |
0.97–2.28 1.41–3.13 |
Age < 65 y/o 65–74 y/o ≥ 75 y/o |
Reference 1.22 1.62 |
0.92–1.62 1.25–2.10 |
Others vs. medical center |
8.91 |
1.41–56.17 |
Age < 65 y/o 65–74 y/o ≥ 75 y/o |
ref. 2.99 7.40 |
2.42–3.69 6.15–8.90 |
|
Valvular disease |
0.45 |
0.28–0.72 |
Others vs. medical center |
1.50 |
1.21–1.86 |
α -glucosidase inhibitors |
9.45 |
0.68–130.60 |
Female vs. male |
0.52 |
0.45–0.61 |
|
Hypertension |
0.63 |
0.44–0.90 |
Cardiac arrhythmias |
1.51 |
1.05–2.17 |
Glinides |
14.15 |
1.46–136.80 |
Valvular disease |
1.43 |
1.07–1.91 |
|
Lymphoma |
5.51 |
0.95–32.15 |
Diabetes, uncomplicated |
1.61 |
1.23–2.11 |
Fast-acting insulins |
4.31 |
0.93–19.97 |
Peripheral vascular disorders |
0.45 |
0.29–0.70 |
|
β -blockers |
0.65 |
0.45–0.93 |
Renal failure |
2.27 |
1.54–3.34 |
Number of outpatient visit |
0.92 |
0.87–0.98 |
Hypertension |
0.80 |
0.66–0.96 |
|
Statins |
0.58 |
0.38–0.89 |
AIDS/HIV |
5.62 |
0.98–32.30 |
Renal failure |
1.27 |
1.02–1.59 |
|||
|
Number of emergency room visit |
1.07 |
1.00–1.16 |
Lymphoma |
3.05 |
1.09–8.54 |
Solid tumor without metastasis |
0.74 |
0.60–0.92 |
|||
|
Number of hospitalization |
1.14 |
1.01–1.30 |
Coagulopathy |
3.89 |
1.65–9.17 |
Weight loss |
1.91 |
1.27–2.88 |
|||
|
Other neurological disorders |
0.33 |
0.18–0.60 |
Fluid and electrolyte disorders |
1.40 |
1.10–1.79 |
||||||
|
Blood loss anemia |
1.72 |
1.11–2.68 |
|||||||||
|
Alcohol abuse |
2.79 |
1.96–3.97 |
|||||||||
|
Psychoses |
2.38 |
1.52–3.72 |
|||||||||
|
Thiazolidinediones |
0.63 |
0.41–0.96 |
|||||||||
|
Fast-acting insulins |
1.38 |
1.10–1.74 |
|||||||||
|
Directics |
1.85 |
1.56–2.19 |
|||||||||
|
Antiarrhythmics class I and III |
1.68 |
1.29–2.18 |
|||||||||
|
Number of outpatient visit |
0.99 |
0.99–1.00 |
|||||||||
|
Number of emergency room visit |
1.02 |
1.01–1.03 |
|||||||||
|
Number of hospitalization |
1.10 |
1.05–1.16 |
|||||||||
|
30-day mortality |
|||||||||||
|
Age < 65 y/o 65–74 y/o ≥ 75 y/o |
Reference 1.15 2.07 |
0.70–1.88 1.34–3.18 |
Age < 65 y/o 65–74 y/o ≥ 75 y/o |
Reference 1.18 1.53 |
0.87–1.59 1.16–2.01 |
Pulmonary circulation disorders |
> 999.999 |
– |
Age < 65 y/o 65–74 y/o ≥ 75 y/o |
Reference 3.18 7.33 |
2.44–4.14 5.78–9.29 |
|
Valvular disease |
0.39 |
0.22–0.69 |
Others vs. medical center |
1.81 |
1.44–2.27 |
Solid tumor without metastasis |
> 999.999 |
– |
Female vs. male |
0.57 |
0.47–0.68 |
|
Hypertension |
0.54 |
0.36–0.81 |
Cardiac arrhythmias |
1.64 |
1.12–2.39 |
no. of outpatient visit |
0.15 |
< 0.0001–141.07 |
Others vs. medical center |
1.23 |
1.02–1.48 |
|
Lymphoma |
8.89 |
1.49–52.96 |
Renal failure |
2.32 |
1.55–3.50 |
Hypertension, uncomplicated |
> 999.999 |
– |
Valvular disease |
1.75 |
1.23–2.50 |
|
Psychoses |
4.09 |
1.09–15.39 |
Coagulopathy |
4.21 |
1.72–10.27 |
Antiarrhythmics class I and III |
0.004 |
– |
Peripheral vascular disorders |
0.37 |
0.19–0.70 |
|
β -blockers |
0.56 |
0.38–0.83 |
Other neurological disorders |
0.37 |
0.20–0.69 |
Hypertension |
0.65 |
0.50–0.83 |
|||
|
Number of emergency room visit |
1.09 |
1.01–1.17 |
Renal failure |
1.44 |
1.08–1.92 |
||||||
|
Liver disease |
1.38 |
1.01–1.87 |
|||||||||
|
Solid tumor without metastasis |
0.76 |
0.57–1.00 |
|||||||||
|
Alcohol abuse |
3.85 |
2.55–5.80 |
|||||||||
|
Psychoses |
2.82 |
1.69–4.71 |
|||||||||
|
Directics |
1.78 |
1.44–2.20 |
|||||||||
|
Antiarrhythmics class I and III |
1.46 |
1.02–2.08 |
|||||||||
|
Number of outpatient visit |
0.99 |
0.99–1.00 |
|||||||||
|
Number of emergency room visit |
1.02 |
1.00–1.03 |
|||||||||
|
Number of hospitalization |
1.09 |
1.02–1.15 |
|||||||||
Abbreviations: AOR, adjusted odds ratio; AUROC, area under receiver operating characteristic curve; CI, confidence interval; CV, cardiovascular; y/o, year-old.
For the patients undergoing CV surgery, the comorbidity of “valvular heart disease” or “hypertension” was not associated with an increased risk of postoperation mortality (Table 3). Treatment with beta-blockers or statins seemed to be protective for the patients undergoing CV operation (Table 3). For neurosurgery, age and underlying comorbidities were important covariates for postoperative mortality (Table 3). As major organ transplantation was considered, the hospital level and the underlying comorbidities might determine the survival rate of the patients after the operation. Patients who underwent organ transplantation at the medical centre achieved better outcomes (Table 3).
For the less risky surgeries, increasing age was associated with a significantly higher risk for postoperative mortality. Hypertension and prescription of thiazolidinediones (TZDs) for diabetes mellitus were associated with decreased postoperative mortality (Table 3) in these less risky surgeries. We also observed that “valvular heart disease” was associated with increased postoperation mortality among less-risk surgeries and that phenomenon was converse among the category of CV surgery (Table 3).
The prediction model was established according to the results of the logistic regression model with forward selection of covariates and formulated as the coefficient of each risk factor, as shown in Tables S5 and S6 in the supplement. By applying an individual’s parameters into the formula, it can be used to estimate the probability of 30-day mortality and in-hospital mortality of each patient.
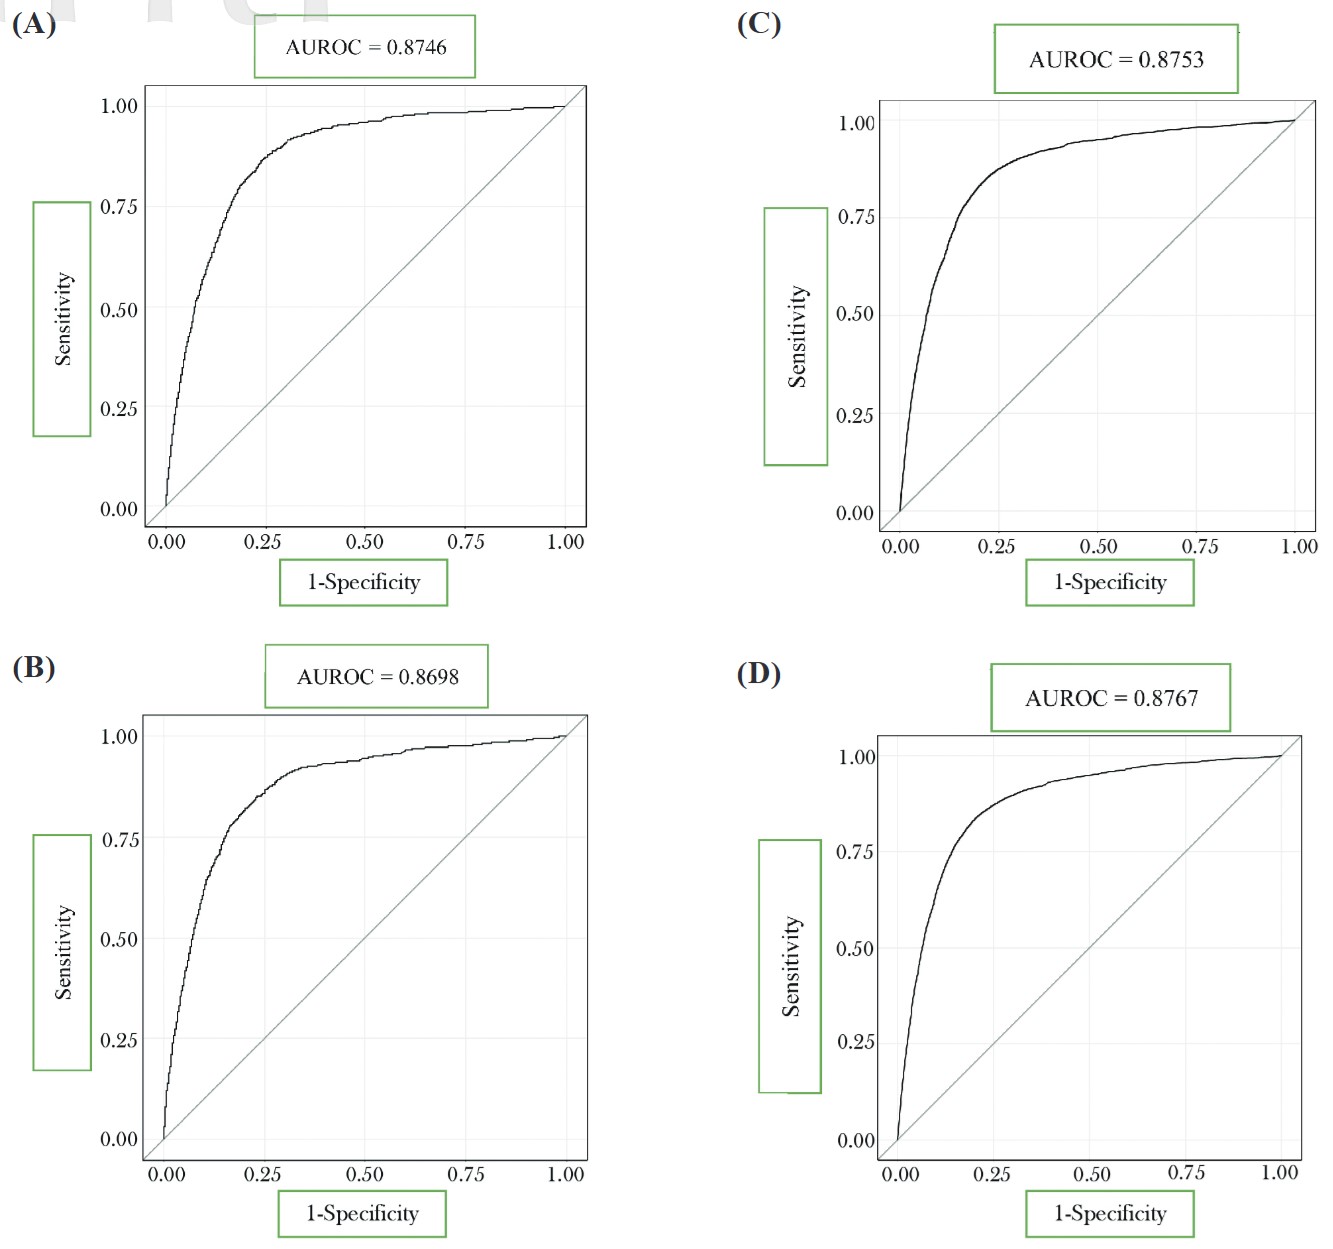
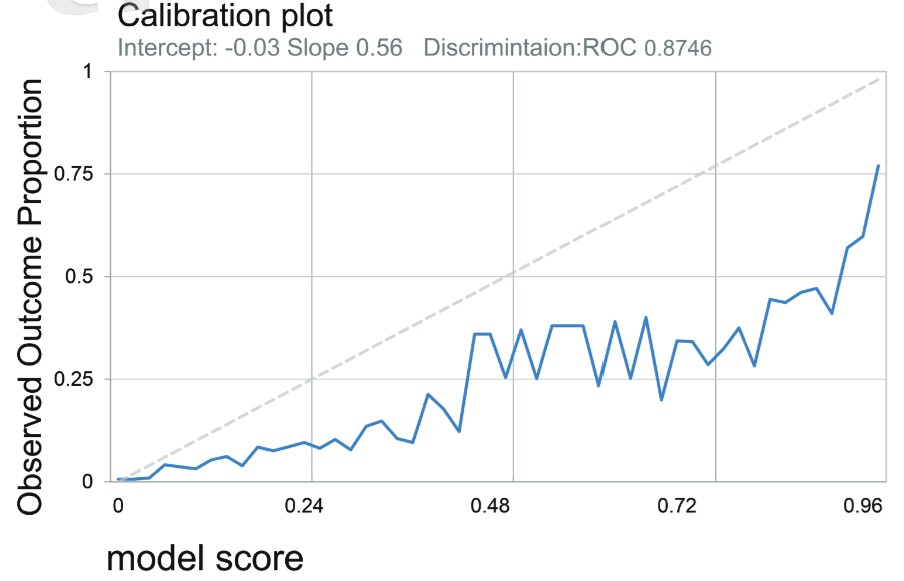
The ROC analysis of this prediction model was initially built in the preliminary group. The optimal AUROC generated from the largest sensitivity and specificity summation for the prediction model of mortality after operation under GA was 0.87 for predicting in-hospital mortality (Figure 2A) and 0.8698 for predicting 30-day mortality (Figure 2B). After the prediction model was built from the preliminary group, further evaluation of the accuracy was conducted in the validation group. The prediction model based on the preliminary group also performed well in the validation group for postoperative mortality. (AUROC = 0.88 for in-hospital mortality; AUROC = 0.88 for 30-day mortality) (Figures 2C and 2D). Validation of this prediction model demonstrated a high level of sensitivity and reliability. The calibration plot from our training population was attached (Figure 3). The calibration plot showed a positive trend to the predicted model, which can show the model is reliable. 15
Download full-size image
Receiver operating characteristic curve (ROC) curves of the prediction model built for all patients in the preliminary group (A) in-hospital mortality (B) 30-day mortality; in the validation group (C) in-hospital mortality (D) 30-day mortality.
Download full-size image
The calibration plot from our training population.
Abbreviation: ROC, receiver operating characteristic curve.
Discussion
To our knowledge, this is the first and largest nationwide study that formally integrates the individual patient’s clinical information (e.g., age, comorbid disease, and medication) to estimate postoperative mortality. We subdivided surgery into high-risk surgery (organ transplantation, CV, and neurosurgery) and non-high-risk surgery (others) to explore the different risk factors for 30-day and in-hospital mortality in each group. The most important factors that contribute to postoperative mortality are the selected surgery types. Some factors could increase or lower the risk of mortality in nonhigh-risk surgery. Our prediction model, built from a smaller set of study populations, remained highly reliable when applied to the whole population.
Our results showed that age was an important determinant associated with postoperative mortality among the different surgical types. Additionally, the multidimensional score of elderly patients, which could possibly improve the prediction, was not present in our current database, and perioperative prescription could reduce the risks of the operation. Our data showed that the potentially protective effects of anti-lipid, hypoglycaemic, and anti-hypertensive agents were encouraging in the geriatric preoperative group. It should be part of the patient’s preoperative preparation as a major contributory factor to the primary causes of perioperative mortality. 16
Hypertension was one of the most common comorbid diseases among the patients who underwent major surgery. However, hypertension was not independently associated with an increased risk of postoperative mortality. As in previous studies, hypertension was highly prevalent in patients presenting for surgery, but its impact on surgical outcome is still under debate. 17 In our study, antihypertensive agents such as beta-blockers and calcium channel blockers were the most commonly prescribed among all of the patients, especially for those in the high-risk groups. On the other hand, valvular heart disease is a major part of CV surgery. Its presence conferred an increased risk for postoperative mortality when the patients underwent less risky surgeries.
Risk factors for patients undergoing surgery with GA are modifiable or non-modifiable. Regular medication usage might be important to reduce the risks of adverse events after surgery with GA. In our prediction model, the use of statins, TZDs, and β-blockers for patients was related to less operative risk and better operation outcomes, indicating that adequate control of CV risk factors 18 could decrease overall mortality. 19,20 However, this is the first study that included medication as a parameter to predict postanesthetic mortality. The potentially protective effects of anti-lipid, hypoglycaemic, and anti-hypertensive agents were encouraging. Further surveys with more complete datasets are warranted.
The types of surgery have determined the risk of postanesthetic mortality. Major surgeries, such as those involving the heart, major vessels, brain, and transplantation, were intrinsically associated with a significantly higher risk for mortality. Among these, neurosurgery was associated with the highest risk of postoperation mortality. In addition to the surgical types, the prediction model we developed also included a variety of personalized information, such as age, comorbidities, medications, hospital level, and recent medical resource utilization. We might incorporate this tool into an on-site information system, and when a new patient is to be admitted to the hospital to receive surgery under GA, the individual’s profile can be acquired immediately with this tool. According to the formula we established (see Tables S5–S7), an individual’s risk of in-hospital and 30-day mortality after GA can be estimated based on the different types of surgery. Clinicians might be able to use this model as a reference to explain the risk of postanesthetic mortality to patients and their families.
Strengths
This is a nationwide, large-scale study that extracted data from the National Taiwan Insurance Database, which enrolled more than 68,000 surgical patients with GA. This database is pioneering and unique to the Asian population. The prediction model included a variety of personalized information in addition to surgical types
Limitations
There are several limitations in our study. First, the study used a claims database in which some crucial information, such as anthropometric data, blood pressure measurements, and laboratory results, is lacking. Using some surrogate variables to develop a prediction model could achieve a differential capacity as high as 88%. However, it is unlikely to get even higher with current data. Second, the database lacks some information to determine the status class in the ASA classification. We were not able to examine the consistency between our prediction model and ASA classification. Third, the patients were exclusively people in Taiwan. The generalizability to other people remains uncertain.
Conclusions
The results of this study not only identified the risk factors associated with different types of surgeries under GA but also explored the protective effect on the adequate control of chronic disease. We established a clinically applicable prediction model from one population and further proved its reliability and stability from the other. It is expected that applying this prediction model in clinical practice could improve surgical risk stratification and further improve patient outcomes.
Author Contributions
FFT: wrote the main manuscript and revised the article; JWL: data collection, data analysis, and prepared Figures 1 and 2; SNC: First drafting, statistics, and table structure; CLC: provided instruction in the Tables and conducted data analysis and IRB application; LPL: IRB application and data collecting; JJH: conducted data collecting and data analysis; HMY proposed the idea, coordinated the whole project, and involved final drafting. All authors reviewed the manuscript and agreed to be accountable for all aspects of the work, ensuring that questions related to the accuracy or integrity of any part of the work are appropriately investigated and resolved.
Conflict of Interest
There are no conflicts of interest to report regarding this study.
Acknowledgments
This study was in part supported by a grant from the National Taiwan University Hospital Yunlin Branch (NTUHYL106.A001). We would like to thank Ms. Homin Chen for her assistance in statistical analyses.
Supplement
All data generated or analyzed during this study are included in this published article as its supplementary files. The link can be accessed here .
References
| 1 |
Quan H, Li B, Couris CM, et al.
Updating and validating the Charlson comorbidity index and score for risk adjustment in hospital discharge abstracts using data from 6 countries.
Am J Epidemiol. 2011;173(6):676-682.
|
| 2 |
Le Manach Y, Collins G, Rodseth R, et al.
Preoperative score to predict postoperative mortality (POSPOM): derivation and validation.
Anesthesiology. 2016;124(3):570-579.
|
| 3 |
Bedford J, Martin P, Crowe S, et al.
Development and internal validation of a model for postoperative morbidity in adults undergoing major elective colorectal surgery: the peri-operative quality improvement programme (PQIP) colorectal risk model.
Anaesthesia. 2022;77(12):1356-1367.
|
| 4 |
Aboosalih S, Rajagopal A, Ravichandran A, Arcot R.
Surgical Outcome Risk Tool (SORT) in emergency surgical patients for outcome assessment.
Indian J Surg. 2022;84(1):240-245.
|
| 5 |
Stolze A, van de Garde EMW, Posthuma LM, et al.
Validation of the preoperative score to predict post-operative mortality (POSPOM) in Dutch non-cardiac surgery patients.
BMC Anesthesiol. 2022;22(1):58.
|
| 6 |
Chung JY, Chang WY, Lin TW, et al.
An analysis of surgical outcomes in patients aged 80 years and older.
Acta Anaesthesiol Taiwan. 2014;52(4):153-158.
|
| 7 |
Fields AC, Dieterich JD, Buterbaugh K, Moucha CS.
Short-term complications in hip fracture surgery using spinal versus general anaesthesia.
Injury. 2015;46(4):719-723.
|
| 8 |
Kim SW, Han HS, Jung H won, et al.
Multidimensional frailty score for the prediction of postoperative mortality risk.
JAMA Surg. 2014;149(7):633-640.
|
| 9 |
Chu CL, Chiou HY, Chou WH, Chang PY, Huang YY, Yeh HM.
Leading Comorbidity associated with 30-day post-anesthetic mortality in geriatric surgical patients in Taiwan: a retrospective study from the health insurance data.
BMC Geriatr. 2017;17(1):245.
|
| 10 |
Lee PC, Wang TH, Chen TY, Peng CH.
Introduction to the National Health Insurance of Taiwan
.
|
| 11 |
Chang CC, Liao CC, Chen TL.
Perioperative medicine and Taiwan National Health Insurance Research Database.
Acta Anaesthesiol Taiwan. 2016;54(3):93-96.
|
| 12 |
Hsieh HC, Hsu JC, Lu CY.
10-year trends in statin utilization in Taiwan: a retrospective study using Taiwan’s National Health Insurance Research Database.
BMJ Open. 2017;7(5):e014150.
|
| 13 |
Butcher NJ, Monsour A, Mew EJ, et al.
Guidelines for reporting outcomes in trial reports: the CONSORT-Outcomes 2022 Extension.
JAMA. 2022;328(22):2252-2264.
|
| 14 |
Patzer RE, Kaji AH, Fong Y.
TRIPOD reporting guidelines for diagnostic and prognostic studies.
JAMA Surg. 2021;156(7):675-676.
|
| 15 |
Eugene N, Oliver CM, Bassett MG, et al.
Development and internal validation of a novel risk adjustment model for adult patients undergoing emergency laparotomy surgery: the National Emergency Laparotomy Audit risk model.
Br J Anaesth. 2018;121(4):739-748.
|
| 16 |
Zambouri A.
Preoperative evaluation and preparation for anesthesia and surgery.
Hippokratia. 2007;11(1):13-21.
|
| 17 |
Lapage KG, Wouters PF.
The patient with hypertension undergoing surgery.
Curr Opin Anaesthesiol. 2016;29(3):397-402.
|
| 18 |
Chou R, Dana T, Blazina I, Daeges M, Jeanne TL.
Statins for prevention of cardiovascular disease in adults: evidence report and systematic review for the US Preventive Services Task Force.
JAMA. 2016;316(19):2008-2024.
|
| 19 |
Lynch KE, Rhee CM, Brunelli SM.
Thiazolidinedione use is associated with improved all-cause mortality compared with sulfonylureas among diabetic hemodialysis patients.
J Diabetes. 2014;6(4):381-383.
|
| 20 |
Naci H, Brugts JJ, Fleurence R, Tsoi B, Toor H, Ades AE.
Comparative benefits of statins in the primary and secondary prevention of major coronary events and all-cause mortality: a network meta-analysis of placebo-controlled and active-comparator trials.
Eur J Prev Cardiol. 2013;20(4):641-657.
|